.webp)
.webp)
.webp)
.webp)


- Endowus portfolios generally fared well compared to benchmark indexes and competitors in the third quarter, and further exemplifies the importance of strategic asset allocation.
- ESG equities portfolio generated another solid quarter with a +2.3% return, and was our best performing equities portfolio for Q3 2021. Year-to-date numbers are now +14.3%.
- Cash/SRS equities portfolio had a muted quarter and gave up gains in September after strong returns in July and August, ending the quarter -0.2%. Year-to-date numbers for equities held up at +15.5%. Our CPF equities portfolio returns were -0.1% for Q3 and +13.4% YTD.
- Fixed income portfolios generally corrected during September but managed to protect capital during Q3, ending the quarter largely flat. The Cash/SRS portfolio was +0.1% and CPF 0.0%, while the ESG fixed income portfolio again produced stellar results with a +0.2% return. These results compared favourably to the benchmark Global Aggregate Index which returned -0.5% for Q3.
- Global macro concerns are rising amidst policy uncertainty in the US and China. Uncertainty has led to recent volatility and short-term market correction. Both equities and fixed income experienced a joint sell-off and correlation across asset classes have risen in this cycle. However, this is balanced out by positive momentum in corporate earnings and continued growth recovery as economic activities normalise.
- Endowus continues to outperform peer platforms in terms of performance. Having broad-based global diversification for your core portfolio and strategically passive asset allocation is the tried and tested way to generate consistent returns over time.
Endowus Q3'2021 Portfolio Insights
Is it a pause that refreshes or is this the beginning of the end of one of the best stretches of market returns for global financial markets? It is rare that a confluence of so many macro factors has affected the financial markets in such a persistent way in both the key markets of the US and China. Whereas last year was an unprecedented and sudden shock to the system as the pandemic unfolded, this quarter has seen a string of events that has begun to weigh on markets. It began with the rapid global resurgence of the Delta variant, raising concerns about growth, coupled with China Tech sector’s policy-induced collapse. Then it spread to the continued inflationary concerns that drove yields higher and fixed income returns lower. Bigger macro issues such as the US Fed’s tightening cycle, a looming energy crisis and last but not least, concerns of rising systemic risk of the over-indebted Chinese economy continue to concern investors in the market. We are currently facing the greatest period of uncertainty since the pandemic began more than 18 months ago.
September has historically been the worst performing month for the stock market, and this year has been no exception. The September effect hit markets again, leading to the first quarterly loss in five quarters, since 18 months ago when the COVID-19 pandemic began. The Endowus portfolios for equities largely held up quite well with slightly positive to slightly negative returns for the 100% equities portfolios, but still managed to eke out a positive number for the quarter for fixed income portfolios. In addition, our ESG portfolios maintained a solid and positive return across the whole spectrum of portfolios delivering again better risk adjusted returns for an active ESG sustainable portfolio. It was another quarter in which the passive strategic asset allocation that Endowus espouses has come through as the best way to manage your wealth relative to actively managed portfolios on other robo-advisor platforms.
The chart below provides a good historical overview of the Endowus portfolios, showing how the Endowus strategies have done well compared to the global benchmark indexes which all performed well through this cycle.

The chart clearly shows that while the three portfolios have slightly differing returns because of the differing underlying options available in building such portfolios for each source of funds, they share similar characteristics as a globally diversified passive strategic asset allocation portfolio. Most of them closely track the global market passive benchmark indexes, as they should, and have generally done quite well against them. This has led to the portfolios significantly outperforming peer investment options and also showing the benefits of diversification in the Endowus portfolio.
We provide commentary and detailed breakdowns of drivers and characteristics for each of the Core Advised Portfolios from Endowus below:

Cash/SRS Core Advised Portfolios
Key Performance Highlights: Q3 2021 was a quarter of muted performance from both equities and fixed income, with our 100% Equity Portfolio generating -0.2% return during this period, and the 100% Fixed Income Portfolio faring slightly better at a 0.1% return.
The muted Q3 returns were deceptive as they followed somewhat of a rollercoaster ride for investors. In the first half of the quarter, the portfolios rode on a favourable wind of recovery in July and August with strong continued positive returns. This was driven by rosy sentiments on the opening up of the global economy and recovery from the COVID-19 pandemic. During this period, the 100% Equity Portfolio recorded a return of 2.8%, while the Fixed Income basket delivered 1.0%. The market, however, was soon infected by concerns of the actual pace of recovery, as well as anxieties surrounding the woes of Evergrande and the China real estate sector and its spillovers, and saw a correction that effectively wiped out all of the quarter’s gain.
The year-to-date performances saw a slight drag as a result, although they still stand at enduring levels supported by strong returns from the first half of 2021, which benefited from factor rotations to value and small companies. For the current quarter, amidst a market-wide correction, the factors have produced results that are in line with the broader market. We persist in our stance that factor tilts towards the long-term proven drivers of return, such as value, small cap and profitability, will drive excess returns in the long run.
On fixed income, our portfolio continues to perform well as compared to major market benchmarks, despite the increased volatility plaguing the Asian high yield space and the rising yield environment driven by the Fed’s policy expectations. The overall portfolios have managed risk well and delivered strong performance that reflect their passive strategic asset allocation focus.
CPF Core Advised Portfolios

Key Performance Highlights: Similar to the Cash/SRS portfolios, the Endowus CPF Core Advised Portfolios finished Q3 largely flat, with 100% Equity doing slightly better than its Cash/SRS counterpart, generating -0.1%, and the 100% Fixed Income Portfolios ending the quarter very much flat.
The monthly trend in returns was again similar to Cash/SRS portfolios, where the portfolios kicked off with a good start through July and August, only to have their returns reverse with September losses. The year-to-date performance experienced a slight drag as a result, excluding the portfolios with a heavy fixed income allocation. This remains heavily attributed to the losses incurred in Q1 of 2021, when the rising rates environment affected the long duration exposure of our fixed income portfolios. Despite the inherent limitation of lack of access to better solutions on the CPF-IS included funds, the portfolios have had a good run and maintain decent year-to-date numbers, especially for equities.
ESG Core Advised Portfolios

Key Performance Highlights: Endowus’ industry-leading ESG sustainable portfolios continued to deliver stellar returns. This highlights how investing in companies with sustainable business practices and risk management processes can reduce risk in the portfolio in the near term, and enhance risk-adjusted returns over the long term. Our ESG portfolios ended the quarter with good gains despite the widespread market downturn and made some recovery versus benchmark indexes after lagging a little during the first half.
The 100% Equity ESG Portfolio generated a return of +2.3% during Q3, which is the best performance among the Endowus advised portfolios, handsomely beating benchmark index returns. After a very strong showing in July and August, the portfolios did generate negative returns in September, in line with the market direction. However, the gains in July and August more than offset the correction in September to maintain a positive return for the quarter. While the concentrated and active portfolios resulted in slightly higher volatility during the third quarter, the overall portfolios were much more defensive. The 100% Fixed Income ESG portfolio also booked a +0.2% return. On the back of another solid quarterly performance, the ESG portfolios further strengthened performance on a year-to-date basis across all of the portfolios.
Endowus portfolios outperform other robo-advisors & benchmark
A common question we get from our clients or at our webinars is how we stack up against competitors and other investment options. While we do not know the exact performance of other robo-advisors, there are many people openly sharing how their portfolios from Endowus and other robo-advisors have performed. Based on these publicly available comparisons, other robos have consistently underperformed throughout this year, while Endowus advised portfolios have had better performance — as they are designed to track, and have indeed actually tracked, passive index benchmark performances — trouncing the robos this year.

We owe our consistent outperformance against our peers to our investment philosophy of being strategic and passive in our asset allocation. We optimise the portfolios to be the most efficient globally diversified portfolios to offer broad and passive exposures. Our aim is never to try to “beat the market” like the others attempt, because trying to beat the market has historically resulted in failing to beat the market, with those investors underperforming the benchmark over time. Both of the two major robos that many people have compared our portfolios against have, at different periods of time, experienced meaningful underperformance against our portfolios, and their active management strategies are probably part of the root cause. Their portfolios have also exhibited higher volatility with four months of negative returns, compared to just one month for Endowus portfolios, year-to-date. No other benchmarks other than the STI and local narrow market indexes show that kind of volatility.

We highlight two articles from prominent blogs that have provided such comparative data. A Seedly article shared by an investor updating his performance across all three major platforms on a monthly basis is a good source, and is updated to third quarter-end data. We have borrowed the performance numbers with updated calculations and index numbers corrected and updated.
There is also a chart from an August Investment Moats article, which is a little more dated, but clearly shows the longer term trend. Endowus beat both its competitors shown in the article in 1Q, 2Q and now 3Q, and therefore on a YTD basis. Moreover, Endowus is the only player that has delivered a positive return every single month during the first eight months, with the first decline appearing only in September. Endowus has generated the best returns with less volatility versus each of the other players, who show four negative months each and significant underperformance against Endowus and most global index benchmarks. We also note that this is just the 100% equity benchmark, and Endowus has an equally strong fixed income portfolio, thus any mixed asset or balanced portfolio would also have achieved strong results.
Q3 2021 Market Updates
The quarter marked the first meaningful bout of volatility and a pullback from the reflationary trade that has been running for the past 18 months. While the global market had been enjoying the tailwind of a post-pandemic economic reopening and accommodative policy support from governments around the world, had seen strong returns in Q1 and Q2 2021, the sentiment has decidedly turned more sombre in recent months and weeks and concerns around the viability and strength of the post-pandemic growth recovery has been raised. Despite the good progress made on vaccination rates globally, the spread of the Delta variant remains persistent putting a spanner in the works in terms of the pace of recovery (shown by the rather disappointing jobs and GDP growth reports). Coupled with the persistent inflationary concerns and policy risk arising in the US and China, the optimistic market expectations are being dampened with investor concerns on stagflation overtaking the dominant narrative in global financial markets.

The increasingly worrying signs out of China has not helped to clear up the overcast outlook, and 3Q returns were eventually turned down into negative territory for the first time in one and half years. Although investors had a preview of Chinese regulatory crackdown on the Tech sector specifically from back in May 2021, the August pullback has been exposing a broader sector and has reminded investors of the wide-spread impact that the Chinese government and its policies have across a broad swathe of the country’s industries and economy. While the market still is uncertain and worried about the outlook and it is a clear drag on returns for the financial markets, some commentators are highlighting the silver lining that the Chinese authorities are addressing some of the structural issues of inequality and also the highly indebtedness nature of the economy and this will be a long term positive for China.
However, the specific concerns on the Chinese real estate sector are very much real. What began as fears of the possibility of default for a specific company - Evergrande, has now had a ripple effect in the broader Chinese real estate sector and even further out to the broader Asian credit market, especially in the high yield segment. At the time of writing, the People’s Bank of China (“PBOC”) has given the long-awaited reassurance that the Evergrande risks are “controllable”, but Evergrande’s share price has yet to recover from its downward trajectory. This is an unfortunate situation following the slightly improving sentiment for Asia credit in July after Huarong, another Chinese property developer previously facing similar concerns, had managed to meet its obligations.
Ultimately, what the fixed income market has been impacted with in Q3 was a combination of macro risks. The first being the concerns of policy and systemic risk in China that has spilled over to impact the Asian and EM markets, which it is a part of. And secondly, the macro concerns resulting from a persistent inflationary environment will result in market yields to move higher as the US Fed and other economies begin embarking on a tightening monetary policy, especially overlapping with a period of fiscal drag.
However, it remains to be seen whether the sluggish September performance is a one-off reflection of the potential risks out there and is largely priced in with the recent correction or whether indeed it forebodes the beginning of a correction driven by stagflation fears and potential policy missteps in the US and China.
3Q 2021 Global Equity Market Performance
Emerging Markets and Asia ex Japan experienced a meaningful correction during Q3, particularly dragged down by downward moves in China and its ripple effects into other closely-related economies in the region. This is a generalisation of course, with some bright spots such as the rebounding Indian market, for example, which had a stellar Q3 with the MSCI India Index returning more than 12%, supported by low interest rates, improved vaccine access and government relief measures.

Similarly, the excitement of an improving COVID-19 situation after being hit over the summer and during the Olympics has seen Japan enjoy a comeback with the market hoping for an end to the state of emergency by the end of the year, fuelled by a high pace of vaccination deployment. There is also some growing optimism that the new Japanese leadership will be able to implement more growth positive economic policies.
Meanwhile, the US equities market benefited from strong positive earnings in August while riding on the relatively dovish commentary coming out of the Fed, but since then we have seen the Fed react to a spate of data that has shown how recent inflationary pressures from supply side bottlenecks and cost-push is surprisingly resilient and not as transitory as at first perceived. This has led the Fed to take on a much more hawkish tone during September to address concerns on growth and inflation.
As illustrated in the quilt table above for market performance by region, the global equity markets have had another quarter of mixed returns from the regional markets. This highlights the importance of having a globally diversified investment portfolio to take advantage of always being exposed to the winners, while hedging the risk away from being overly concentrated in exposure to losers at any given point in time. For example, if you had been heavily exposed to the Chinese Tech sector, a narrow sub-sector within a single country as opposed to globally diversified equities market across the various sectors, you may have been exposed to outperforming sectors in Finance or Commodities as well. It is impossible to time the rotation across geographies and sectors that the financial market experiences even on a quarterly basis, let alone an annual basis.
3Q 2021 Global Fixed Income Market Performance
The Fixed Income market, had a relatively high correlation with the equities market during Q3, and was heavily impacted by the rising interest rate environment with inflationary concerns looming large throughout the second half of the quarter. It was also heavily impacted by the Chinese Real Estate sector, which unlike the Technology sector, is a heavily exposed segment of the fixed income market especially for Asian Credit and High Yield.

While the Fed had previously adopted a more dovish tone in Q2, the nuance turned to a more hawkish one following the Jackson Hole symposium in August. This was in direct response to the more persistent inflationary and consumer price data that was coming through. The global supply chain disruptions and subsequent bottlenecks are causing major cost-push inflation and with companies not having any choice other than to pass on the costs to consumers, the rising consumer pricing is affecting sentiment and even risking the growth recovery. Since then, US Treasury Bills have been undergoing a slow, but steady increase. The persistent COVID-19 cases, as well as lackluster employment and growth statistics could argue for a delay in the tapering and tightening bias that has emerged. However, the dot projections from the Fed official and guidance from the Fed suggests that tapering will certainly begin before the year-end, possibly during November, and that The Fed official expect to begin the interest rate hiking cycle as soon as mid-2022. The direction, commentary and trend seems somewhat similar for the European Central Bank as well.
Given this backdrop, the US and Euro high yields fared better than investment grade bonds as investors rotated out of the safer, but lower-yielding corporate credit. EM debt, on the other hand, driven particularly by risks in the Chinese property sector and Asian high yield space, posted returns in the red.
What is the September Effect & the October Effect?
September is historically the worst performing month in the global stock market, and many people call this the “September Effect”. This year it looks like the September Effect has really hit markets again. However, many people also talk about the “October Effect” because historically some of the biggest single-day falls have occured in October, including the multiple Black Mondays in 1929 and 1987. The Black Monday fall during the Global Financial Crisis was also just days before October, on 29 September 2008.
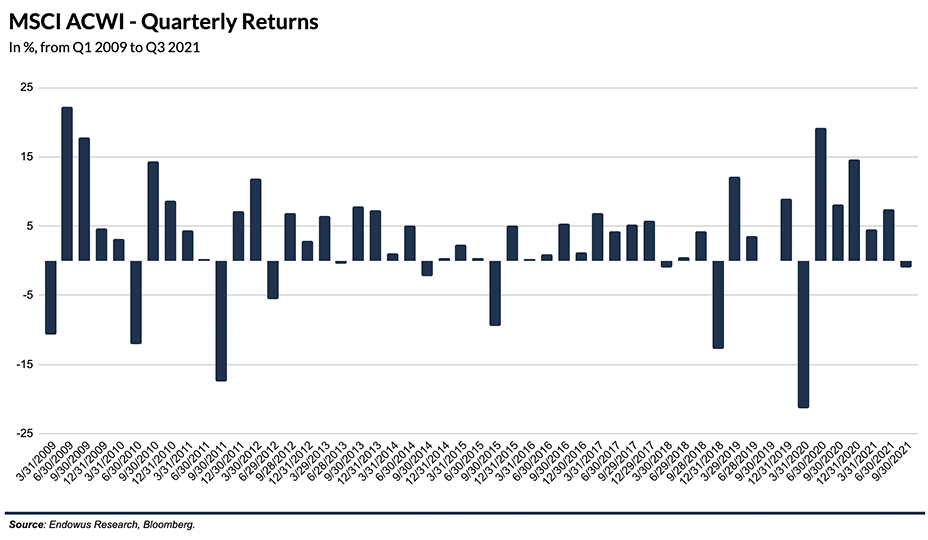
Due to the September fall, the third quarter of this year was the first quarter of negative returns for equity markets since the COVID-19 pandemic hit the financial markets some 18 months ago. This is following five consecutive quarters of steady rise in global equity markets with a total return of 66% on a quarterly basis from 1Q 2020 to 2Q 2021.
Ever since the Global Financial Crisis in 2008/9, the global equity markets have had a correction in one quarter each year from 2009 to 2015. But in 2016 and 2017, there were no corrections and nine consecutive quarters of gains from Q3 2015 to 1Q 2018, when the market went up by 40%. Then in 2018, as if to make up for lost time, the markets showed two negative quarters out of the year. We seem to be going back to the annual trend of one quarter of negative returns which seems to be the long term norm.

Although this pattern is interesting and allows for a fun stroll through market history, ultimately we cannot know whether this year’s single negative quarter, which is the historical norm, will be the only one this year. This is why it is important to always refer to the long term trends in markets and learn from history that markets tend to go up for longer and more than we expect. Investors often sell too early, rather than at the top. The chart shows that trying to time the market is a futile effort and it really is about time in the market, as the market tends to move higher over longer periods.
It is tempting to try to capture the top and sell at the top. However, apart from the fact that it is impossible to know in advance when the top of the market is, more importantly you need to get two decisions right. First to pick the top and sell it big, and second to later buy it back — and hope that you can do it at a lower level from when you sold it. The reason you need to buy it back is because of the story that the chart above tells us. There are many people who sometimes get the first call to sell right. They seldom or never make the right second call, instead buying back when it’s too late and paying a higher price than when they sold it. Or worse — they never buy it back and regret it forever because markets will never go back to where they could have bought it.

This is not just an opportunity lost but in behavioural finance it is called “perceived loss”. Even though you are not losing money, and in fact you are not even invested, you are reminded of the investment you used to have or the fact that you could bought in at a lower price. That gap in the current price and the price you “could have” have bought it for or “should have” held onto it at, is perceived by your brain as an actual loss and it weighs on you psychologically, as much as if you had actually lost that money.
In addition to this risk of perceived loss and the guilt or regret that comes with it, the emotional and psychological toll of trying to get the sell and the buy right is a heavy additional cost. It is so much better to be passive, and not have any emotional baggage (or the pressure to get things that are completely out of your control correct) is a blessing. You can go on with living your life and focusing on the priorities of your life instead of trying something that results in failure for the vast majority of people who have tried it.
It is, therefore, important for us to maintain this long term perspective in investing and building wealth for the long term. It is doubly important that we stay disciplined and invest for the long term. Once again our strategic asset allocation has helped you receive the market exposure that ensures long term success across all risk levels. We encourage you to stick to your portfolios, rather than tinker with the allocation at the onset of volatility. Timing the markets with allocation based on market conditions, as shown by our competitors’ performance, is bound to lead to poor outcomes and unhappiness.
<divider><divider>
Investment involves risk. Past performance is not necessarily a guide to future performance or returns. The value of investments and the income from them can go down as well as up, and you may not get the full amount you invested. Rates of exchange may cause the value of investments to go up or down. Individual stock performance does not represent the return of a fund.
Any forward-looking statements, prediction, projection or forecast on the economy, stock market, bond market or economic trends of the markets contained in this material are subject to market influences and contingent upon matters outside the control of Endow.us Pte. Ltd (“Endowus”) and therefore may not be realised in the future. Further, any opinion or estimate is made on a general basis and subject to change without notice. In presenting the information above, none of Endowus Pte. Ltd., its affiliates, directors, employees, representatives or agents have given any consideration to, nor have made any investigation of the objective, financial situation or particular need of any user, reader, any specific person or group of persons. Therefore, no representation is made as to the completeness and adequacy of the information to make an informed decision. You should carefully consider (i) whether any investment views and products/ services are appropriate in view of your investment experience, objectives, financial resources and relevant circumstances. You may also wish to seek financial advice through a financial advisor or the Endowus platform and independent legal, accounting, regulatory or tax advice, as appropriate.
Investment into collective investment schemes: Please refer to respective funds’ prospectuses for details of the funds, their related fees, charges and risk factors, The listing of units of the fund on a stock exchange does not guarantee a liquid market for the units. Before making an investment decision, you are reminded to refer to the relevant prospectus for specific risk considerations.
For Cash Smart Secure, Cash Smart Enhanced, Cash Smart Ultra: It is not a bank deposit and not capital guaranteed, and is subject to investment risks, including the possible loss of the principal amount invested. Investment products are not insured products under the provisions of the Deposit Insurance and Policy Owners Protection Schemes Act 2011 of Singapore and are not eligible for deposit insurance coverage under the Deposit Insurance Scheme. Interest rates are indicative and subject to change at any time.
Product Risk Rating: Please note that any product risk rating (the “PRR”) provided by us is an internal rating assigned based on our product risk assessment model, and is for your reference only. The PRR is subject to change from time to time. The PRR does not take into account your individual circumstances, objectives or needs and should not be regarded as advice or recommendation to purchase, hold or sell any fund or make any other investment decisions. Accordingly, you should not solely rely on the PRR in making your investment decision in the relevant Fund.
This advertisement has not been reviewed by the Monetary Authority of Singapore.


.jpg)

%20(1).gif)