Amundi Core MSCI Emerging Markets Fund(LU2420246139)
- Equities
- Emerging markets
- SGD Cash, CPF OA, SRS
- Accumulating
The Fund seek to track the performance of MSCI Emerging Markets Index, and to minimize the tracking error between the net asset value of the sub-fund and the performance of the Index
Provides investors with passive and low cost exposure to the MSCI Emerging Markets Index. Represents an inexpensive offering to a broad, global universe of companies, reflecting the performance of over 1,000 large and mid-cap equities across 24 emerging market countries.
Managed by Amundi, a recognized leader in passive investment strategies, with more than EUR 480 billion in assets under management within their ETF franchise. The firm brings over 30 years of track record, replicating more than 400 indexes across Equity and Fixed Income.
Since its inception in 2016, the Fund has effectively tracked the MSCI Emerging Markets Index with a difference in performance lower than 1%. The Fund's low expense ratio aids in cost-effective tracking of the Index.
Employs a physical replication strategy to replicate the Index's return by investing in a diversified universe of large- and mid-cap equities across emerging countries, while holding a similar number of constituents to that of the Index. This approach, supported by Amundi's investment expertise, aims to ensure accurate and effective Index tracking.
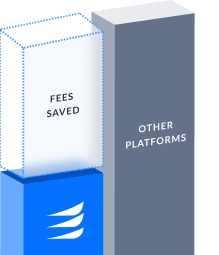
Access to clean retail share class with no trailer fees to achieve the lowest possible fees
Investors looking to gain a passive and cost-effective exposure to the MSCI Emerging Markets Index can consider the Fund as a satellite position for equity allocation, due to the Fund's globally diversified universe of large and mid-cap equities in emerging countries. Investors should remain mindful that the Fund is a regional equity strategy and will likely experience periods of heightened volatility and make sure their portfolio remains geographically diversified in most cases.
Daily data. Returns as of 13 Oct 2026.
| Year | Total | Jan | Feb | Mar | Apr | May | Jun | Jul | Aug | Sep | Oct | Nov | Dec |
| 2026 | - | 7.5% | 5.0% | -11.4% | 13.4% | 9.8% | -0.0% | -3.9% | 2.4% | -1.0% | - | - | - |
| 2025 | 26.0% | 1.1% | -0.0% | 0.3% | -1.5% | 2.8% | 4.9% | 2.4% | 0.4% | 9.0% | 5.2% | -2.9% | 2.1% |
| 2024 | 12.0% | -2.4% | 5.4% | 1.4% | 1.7% | 0.9% | 4.2% | -1.0% | -1.0% | 4.9% | -1.3% | -4.0% | 3.2% |
| 2023 | 6.8% | 5.8% | -4.2% | 1.7% | -0.8% | -1.0% | 4.5% | 3.4% | -4.7% | -0.9% | -4.3% | 5.2% | 2.6% |
| 2022 | - | - | - | - | -3.7% | -0.3% | -5.3% | -0.8% | 0.4% | -8.4% | -4.4% | 10.2% | -2.6% |
| Taiwan Semiconductor Manufacturing Co Ltd | 15.70% |
| Samsung Electronics Co Ltd | 7.77% |
| SK hynix Inc | 6.12% |
| Tencent Holdings Ltd | 2.68% |
| MediaTek Inc | 1.82% |
| Alibaba Group Holding Ltd Ordinary Shares | 1.81% |
| Samsung Electronics Co Ltd Pfd Registered Shs Non-Voting | 0.97% |
| Delta Electronics Inc | 0.93% |
| China Construction Bank Corp Class H | 0.83% |
| Hon Hai Precision Industry Co Ltd | 0.79% |
| HDFC Bank Ltd | 0.69% |
| Petroleo Brasileiro SA Petrobras | 0.69% |
| SK Square | 0.65% |
| ASE Technology Holding Co Ltd | 0.61% |
| ICICI Bank Ltd | 0.59% |
Disclaimer: ©2025 Morningstar. All Rights Reserved. The information contained here relating to a particular collective investment scheme: (1) is proprietary to Morningstar Research Pte. Limited and/or its content providers (“Information Provider(s)“) unless otherwise specified; and (2) may not be copied or distributed. Neither the Information Provider nor Endowus guarantee or endorse the accuracy, reliability, completeness or timeliness of the information, or are responsible for any damages or losses arising from any use of this information. Further, for technical reasons, certain information provided by Information Provider may be different from that supplied by the respective fund houses.
This website is for information purposes only and is not and should not be construed as an offer or the solicitation of an offer or a recommendation for the purchase or sale of any investment or subscribe for, or to participate in, any services. Any opinion or estimate above is made on a general basis and none of Endowus, nor any of its affiliates, representatives, or agents have given any consideration to nor have made any investigation of the objective, financial situation, or particular need of any user, reader, any specific person or group of persons. Opinions expressed herein are subject to change without notice. You should carefully consider whether any investment views and investment products/services are appropriate in view of your investment experience, objectives, financial resources and relevant circumstances or seek financial advice via Endowus' platform.
Investment involves risk. The value of investments and the income from them can go down as well as up, and you may not get the full amount you invested. Past performance is not an indicator nor a guarantee of future performance. Rates of exchange may cause the value of investments to go up or down. Individual stock performance does not represent the return of a fund.
You are responsible for downloads from this website. Endowus does not warrant that any downloads from this website will meet your needs or expectations, or be uninterrupted, secure, or error free or that any files available for downloading through this website are free of computer viruses or other harmful components. You alone are responsible for ensuring adequate protection and backup of data, software, computer, and other equipment is made and appropriate safeguard is in place to detect, prevent and eliminate computer viruses and other harmful effects. Neither Endowus nor the Information Provider will be responsible for any costs or expenses which may be incurred if your use of this website or if any downloads results in any servicing or replacement of property, material, equipment, or data.
This advertisement has not been reviewed by the Monetary Authority of Singapore.