.webp)
.webp)
.webp)
.webp)






- Emerging market debt can be broadly divided into two sub-asset classes by funding currency: hard currency bonds are issued in, and repay, US dollars, while local currency bonds pay in the issuer's own currency and pass the exchange rate risk to the investor.
- Roughly 47% of the long-run return on the main hard currency index came from US Treasury duration rather than emerging market credit, while local currency returns have been driven mainly by emerging market exchange rates; past performance is not necessarily a guide to future performance or returns.
- Because the Hong Kong dollar is pegged to the US dollar, a Hong Kong investor in hard currency emerging market debt carries little residual currency risk, whereas local currency exposure is unaffected by the peg — and a currency-hedged share class hedges only the share class, not the fund's underlying emerging market currencies.
Emerging market governments and companies sold about US$450 billion of international bonds in the first half of 2026, roughly 15% more than in the same period of 2025. Mexico, Saudi Arabia, South Korea, Poland, Turkey, and Brazil each raised more than US$10 billion. That is a sharp reversal for an asset class that had seen three consecutive years of outflows through 2024.
Emerging market debt is not a single position. It divides into two sub-asset classes according to the currency the borrower funds in, and that choice — not the choice of manager — sets the risk-return profile and the dominant return driver: American interest rates for hard currency debt, and emerging market exchange rates for local currency debt.
This article sets out how the two sleeves are built, what has actually driven the returns of each, and how they behaved through the 2022 rate shock and the 2025 dollar decline. It closes with what the two share today, and with a question that matters more in Hong Kong than almost anywhere else: what the Hong Kong dollar's peg to the US dollar means for the currency risk you are taking.
Whose currency is the debt written in?
An emerging market government that needs to borrow has two options. It can issue in its own currency, which leaves the lender carrying the exchange rate risk. Or it can issue in a hard currency — most often US dollars, but also euros, sterling, yen, or Swiss francs — and carry that risk itself.
The trade-off is between the coupon and the currency. To repay debt in a currency that is not its own, a government or company must earn or source hard currency, which is not always easy when reserves are thin. For years, many emerging markets had little choice but to issue in hard currency, because their local currencies were too volatile for international investors. That has changed: most issuance today is in local currency, though heavy local issuance from China skews the picture.
The hard currency sleeve that international investors more often own is the smaller share, but it remains sizeable — around US$1.4 trillion of sovereign debt and US$2.5 trillion of corporate debt as at December 2024, according to UBS Asset Management. The two sleeves carry separate benchmarks, admit different countries, and behave differently.
What drives hard currency returns, and what did 2022 reveal?
A US dollar bond issued by Colombia pays US dollars. For a dollar-based investor that removes exchange rate risk, but it layers two risk premia: American interest rate risk, and emerging market credit risk — the odds that a given country cannot repay. The credit premium is usually the reason to hold the sleeve; an investor who only wants Treasury exposure can buy Treasuries directly.
The share of return attributable to US duration is large. Artisan Partners' EMsights team, using data to 31 December 2025, found that US duration accounted for 47% of the EMBI Global Diversified's annualised return of 5.61% over the previous two decades. Just under half of what a hard currency emerging market bond fund paid its investors was, in effect, a US Treasury return. Past performance is not necessarily a guide to future performance or returns.
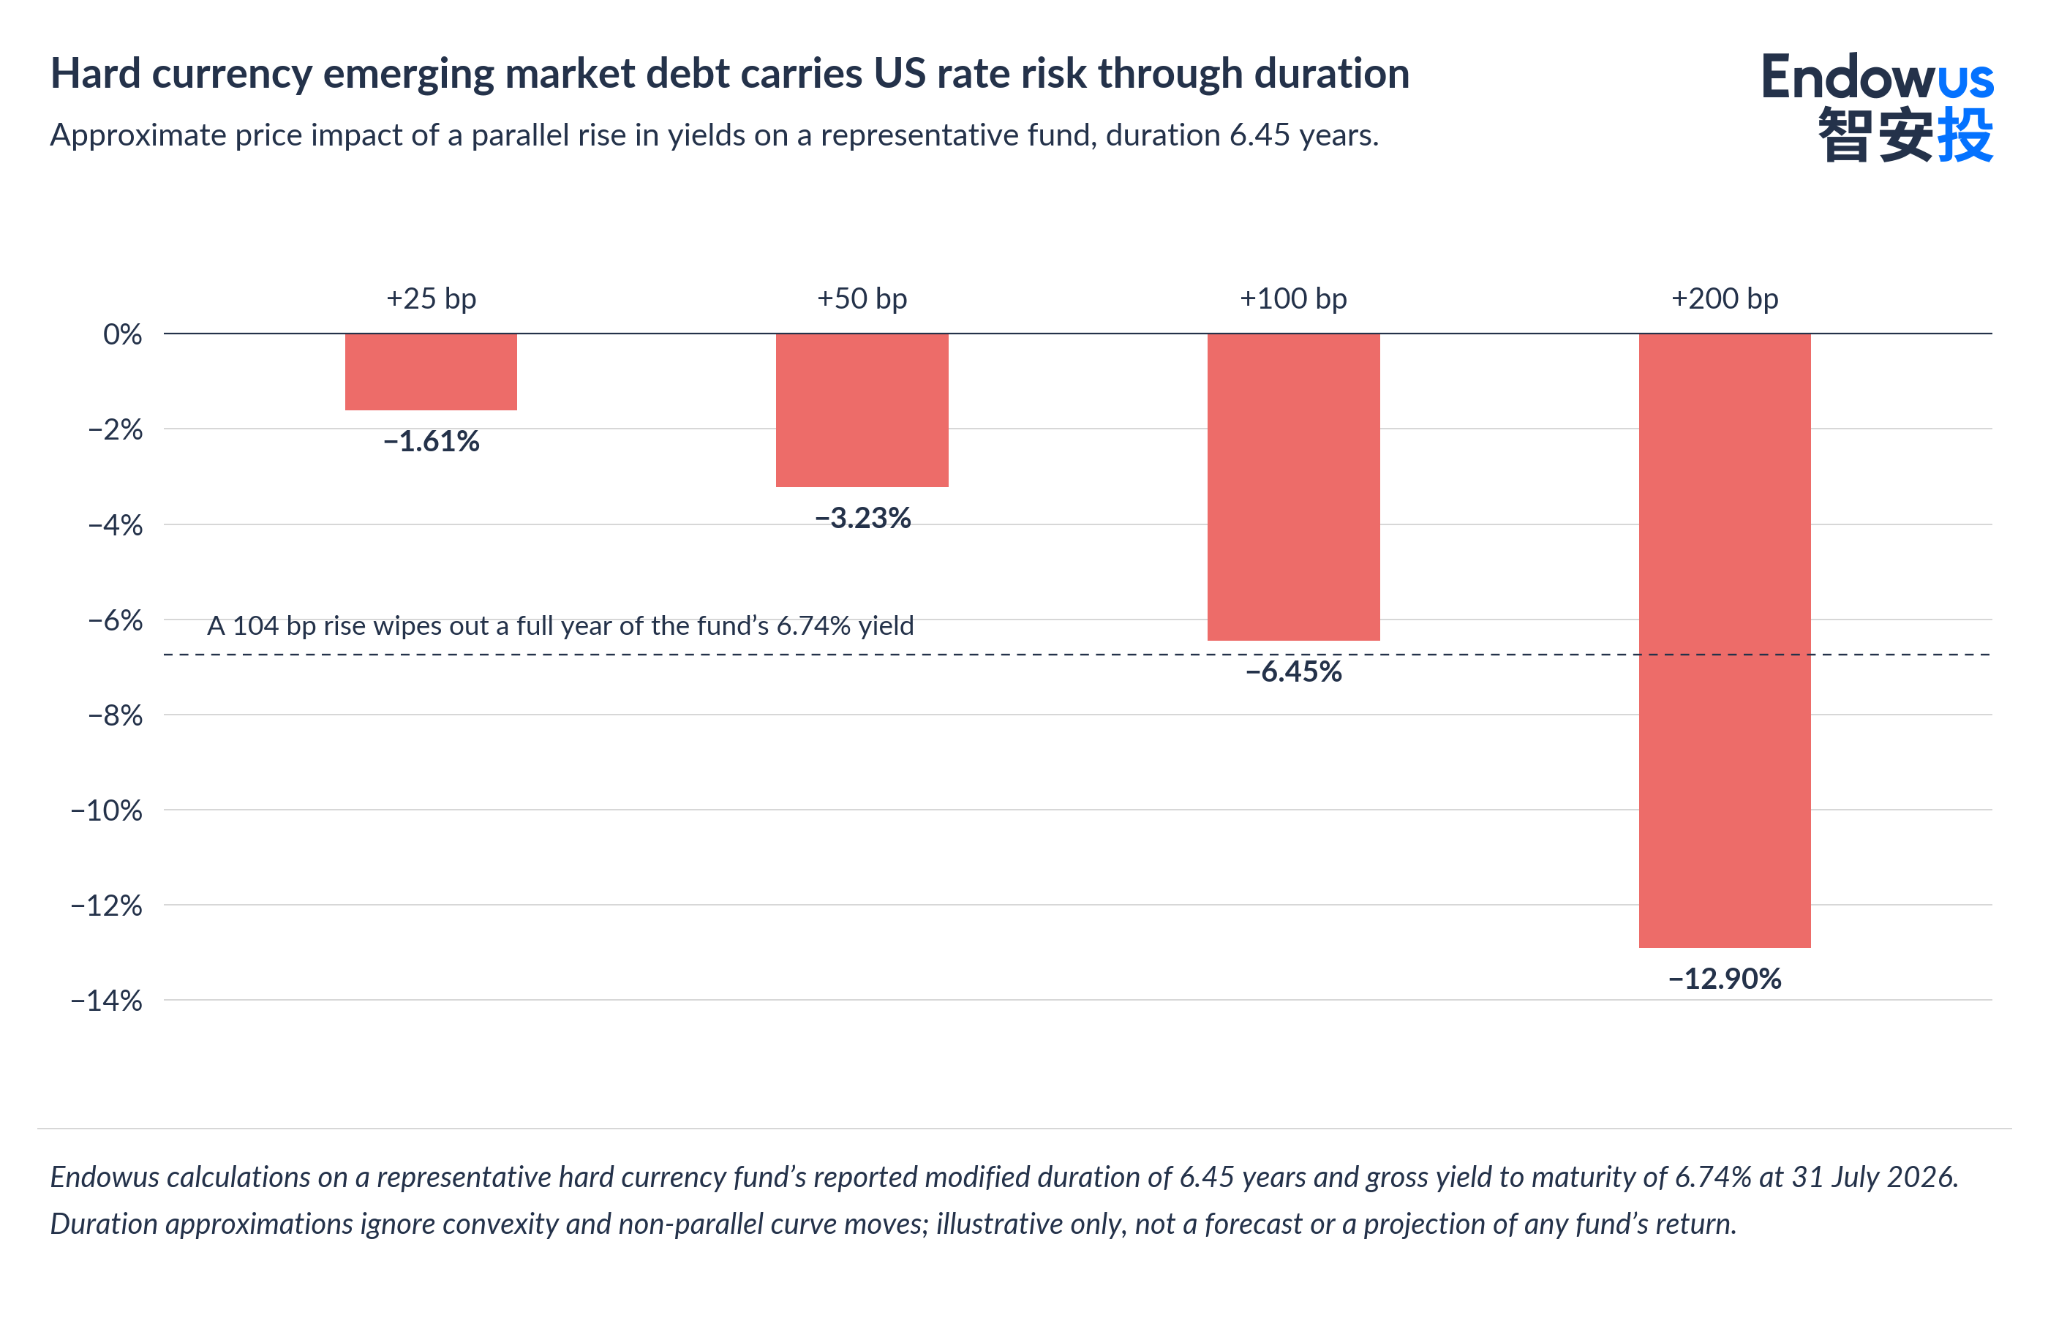
Duration measures how much a bond portfolio's price moves when yields change. A representative US$3.8 billion hard currency fund reported 6.45 years of duration and a gross yield to maturity of 6.74% at 31 July 2026. A parallel rise of just over one percentage point in yields — 104 basis points — may erase a full year of that income through the fall in price; a fall of the same size may add slightly more, because of convexity.
The 2022 sell-off showed which risk dominates. The EMBI Global Diversified fell 17.8% that year. The headlines were about defaults — Russia left the index after the invasion of Ukraine, Sri Lanka defaulted in April, Ghana suspended payments in December, and Zambia had been in default since 2020 — but those credits carried small index weights, compressed further by the index's capping rules. The dominant force was US Treasury yields: the 10-year rose from a December 2021 average of 1.47% to 3.62% a year later, a move of 215 basis points that fell hardest on a high-duration index. For why bond funds fell in 2022, see Endowus — A Quick Guide in Bond Investing.
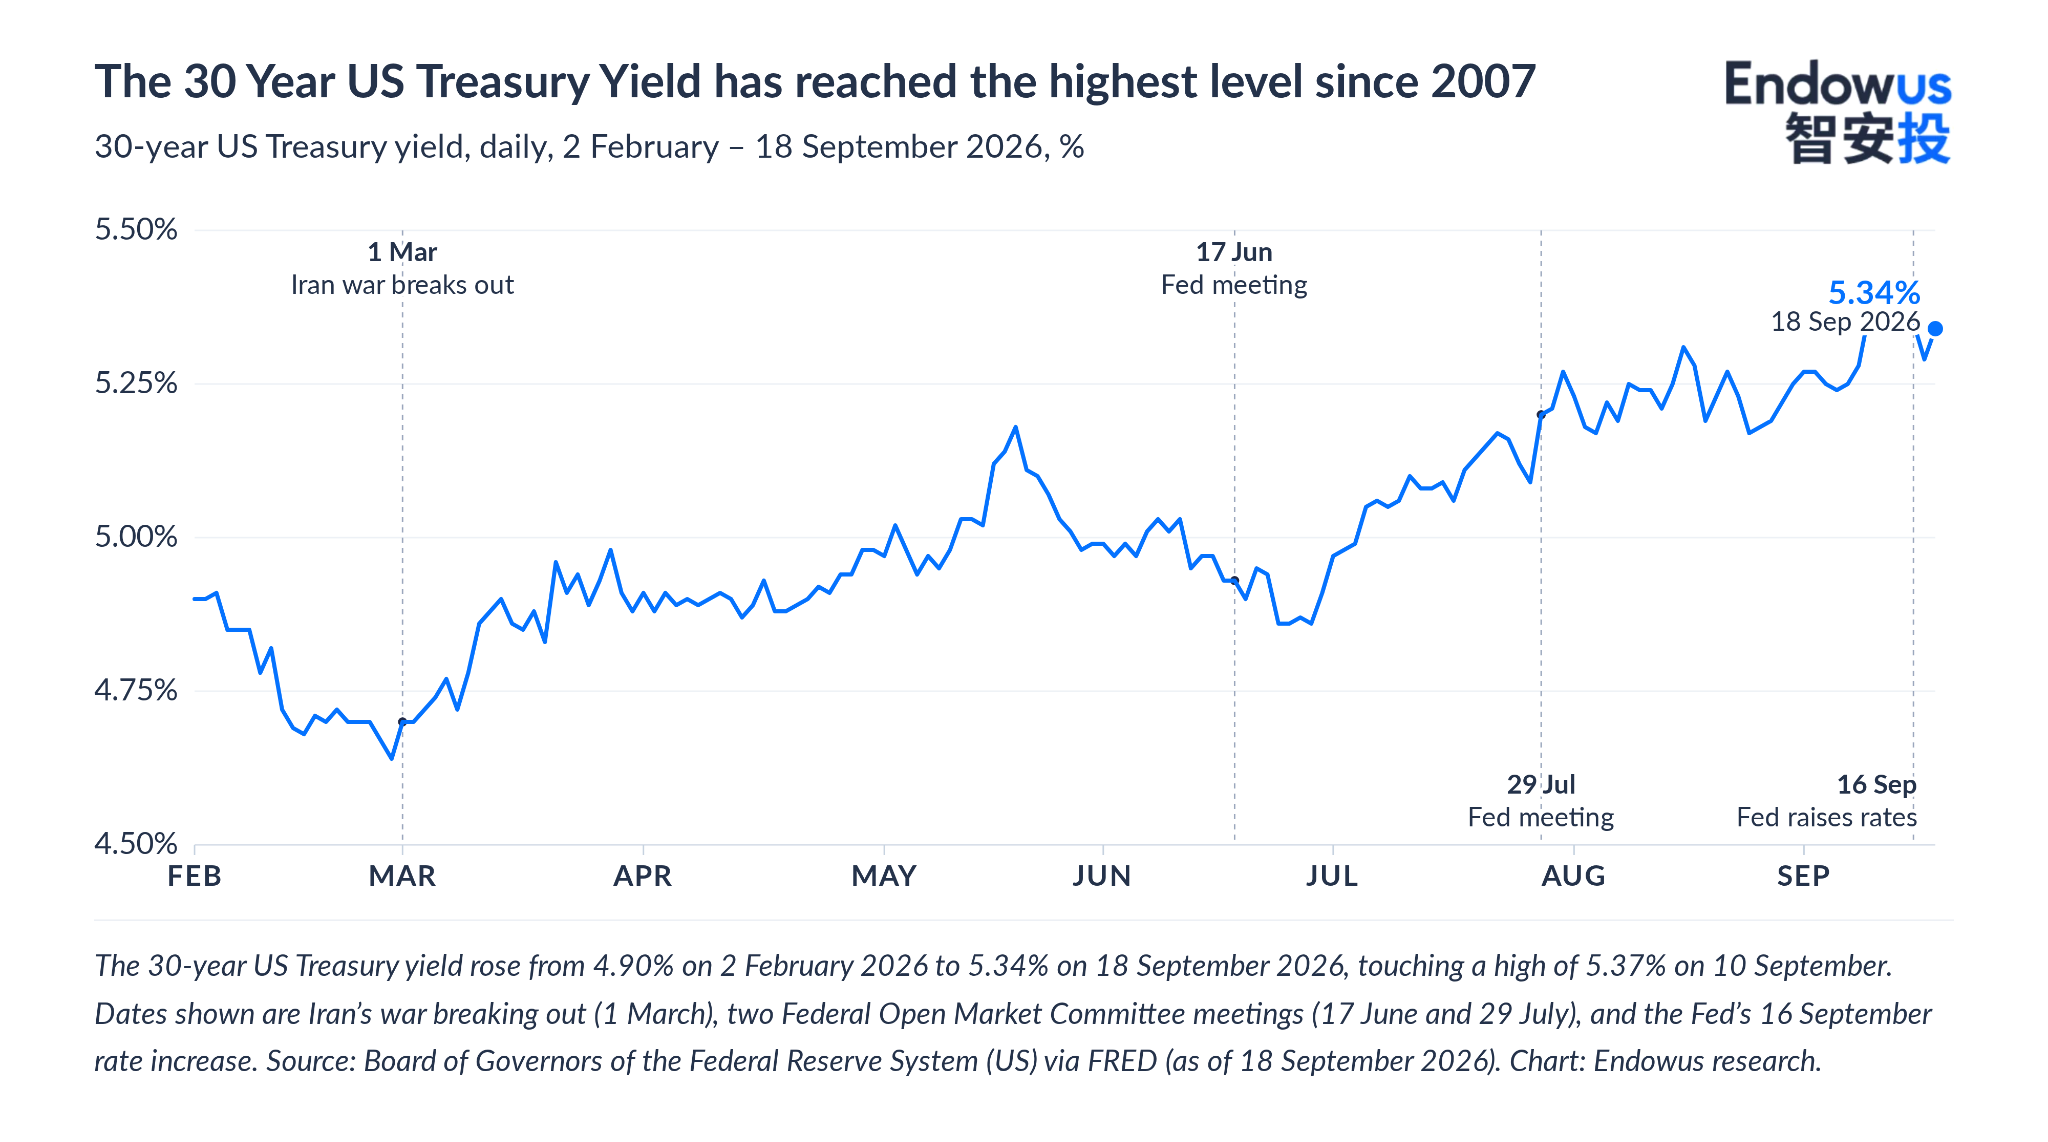
The counterintuitive part came later. The Federal Reserve began cutting its policy rate in September 2024, yet over the same period the US 10-year yield rose, from around 3.8% to roughly 4.8%. Hard currency emerging market debt is priced off the long end of the Treasury curve, not the policy rate, so "the Fed is cutting" does not create a direct impact on the asset class is not, on its own, good news for the asset class.
That distinction matters again now: the Federal Open Market Committee held its target range at 3.50% to 3.75% on 29 July 2026 and raised its target range for 25 bps at 3.75% to 4.00% on 16 September 2026, and the 30-year Treasury reached its highest level since 2007 during August 2026.
What actually sits inside an emerging market index?
Two features of the EMBI Global Diversified are worth knowing before treating it as a passive default.
First, how countries qualify. A country enters if its gross national income per capita sits below the index's income ceiling — US$24,325 for 2026 — for three consecutive years, or if its cost of living sits below a set purchasing-power ratio. That written test, not a judgment about economic development, is why Gulf sovereigns entered from 2019 at a combined weight of about 11%.
Second, defaulted bonds are not removed. As of 31 December 2025 the index still held Venezuela, Lebanon, and Ethiopia, all in default. Passive exposure therefore includes credits in active restructuring. Traditional mutual funds, pension funds, and ETFs are bound by mandates that force them to immediately sell defaulted paper regardless of price, leaving only a tiny pool of specialized buyerslooking at the expected recovery rate instead of the yield. Thus, defaulted paper trading at very wide nominal spreads also lifts the index's average yield, so the headline yield overstates what a holder is likely to realise — and physically replicating funds often hold less of it than the index implies, which introduces tracking error of its own.
Diversification is enforced by capping. J.P. Morgan caps the largest countries and redistributes the excess to smaller ones, subject to a hard 10% ceiling per country. The effect is to compress large issuers such as Mexico, Turkey, and Brazil and to lift the tail of smaller, lower-rated, less liquid frontier sovereigns — which now make up roughly a third of the index's constituents, about double the share of ten years ago.
Has the sovereign restructuring cycle been resolved?
The four years from 2022 contain a complete sovereign debt cycle: a default wave, negotiation through 2023, exchanges closing in 2024, and market access restored in 2025 and 2026. That Gabon — a country in Central Africa — could raise US$920 million in July 2026 tells you the market has reopened even to weaker credits. The more useful lesson is the dispersion of outcomes.
Recovery values ranged from roughly 25 cents in the unresolved Lebanese case — which means 25% of the original face value — to about 71 cents in Ghana. Dispersion that wide means a default carries no standard haircut, and the IMF notes that emerging market sovereign bond restructurings take an average of around 13 months to implement, due to the complex legal, regulatory, and financial structuring required. For a holder of distressed paper, that is the practical cost: a long wait with an uncertain payoff.
One statistic cuts against the asset class's reputation. The ten-year average emerging market sovereign default rate over 2014 to 2024 was 2.20%, against 2.70% for US high yield. The market most associated with default risk in retail perception defaulted less often than the domestic US high yield market over that window.
What drives local currency returns?
Local currency debt inverts the trade. The investor lends in the borrower's own money, so there is no obligation to find US dollars — but the investor now carries the exchange rate risk. That shifts the dominant driver of returns from American interest rates to emerging market currencies.
How much it dominates depends on the holding period. Over January 2003 to January 2025, Robeco found a 0.95 correlation between currency returns and total local currency returns. State Street's attribution shows the mechanism month by month.
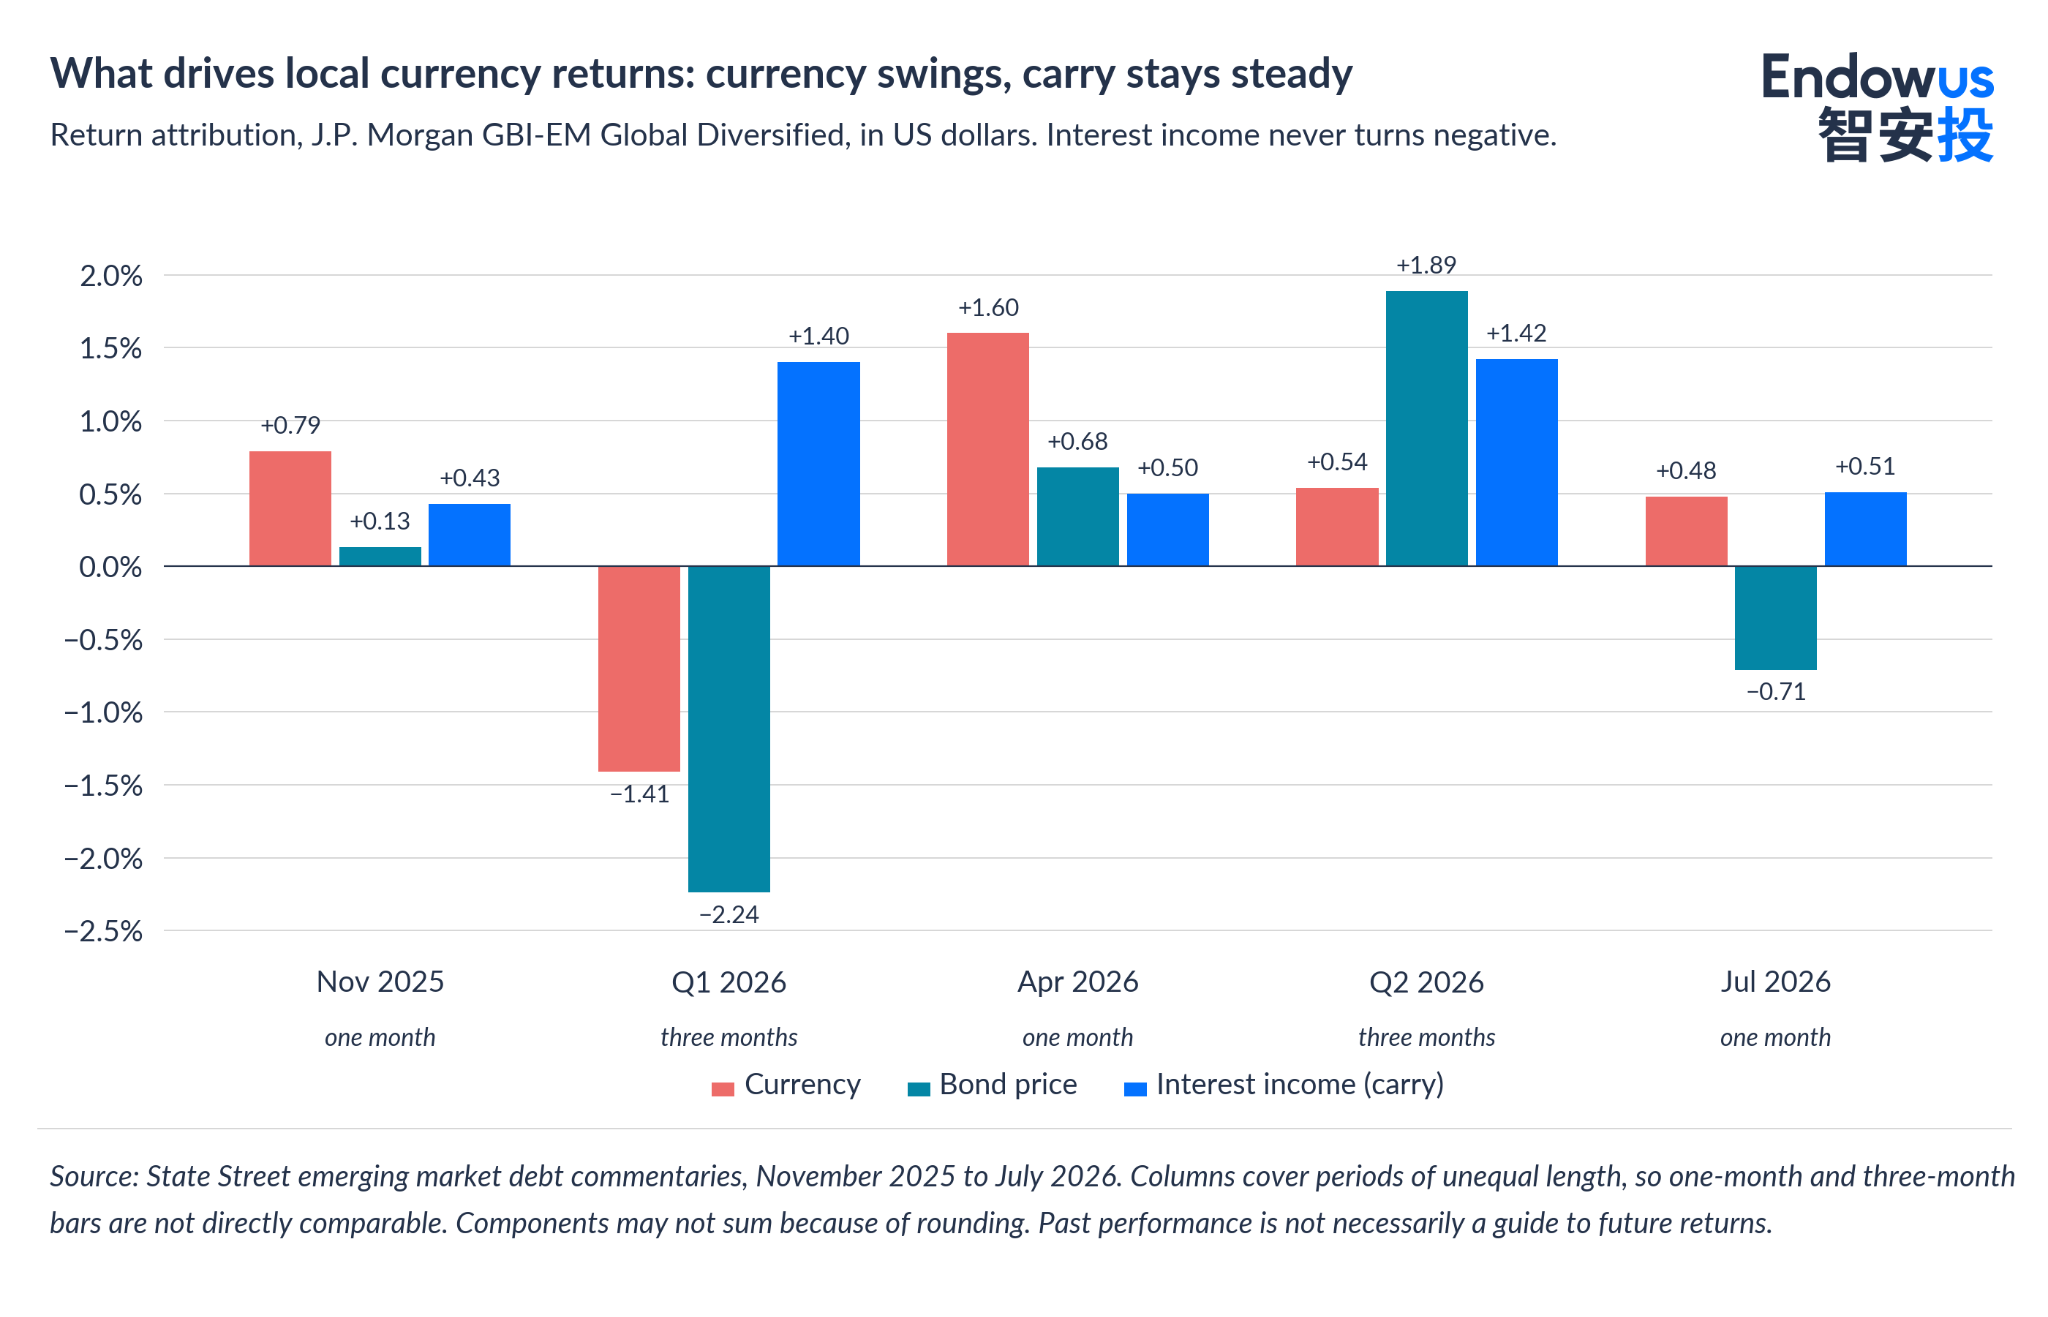
Interest income — the carry — never turns negative in the periods shown, while the currency line swings from −1.41% to +1.60%. Carry is the reliable part of the return; the currency is the volatile part. That volatility is clearest across calendar years, once it is not compressed into an average.
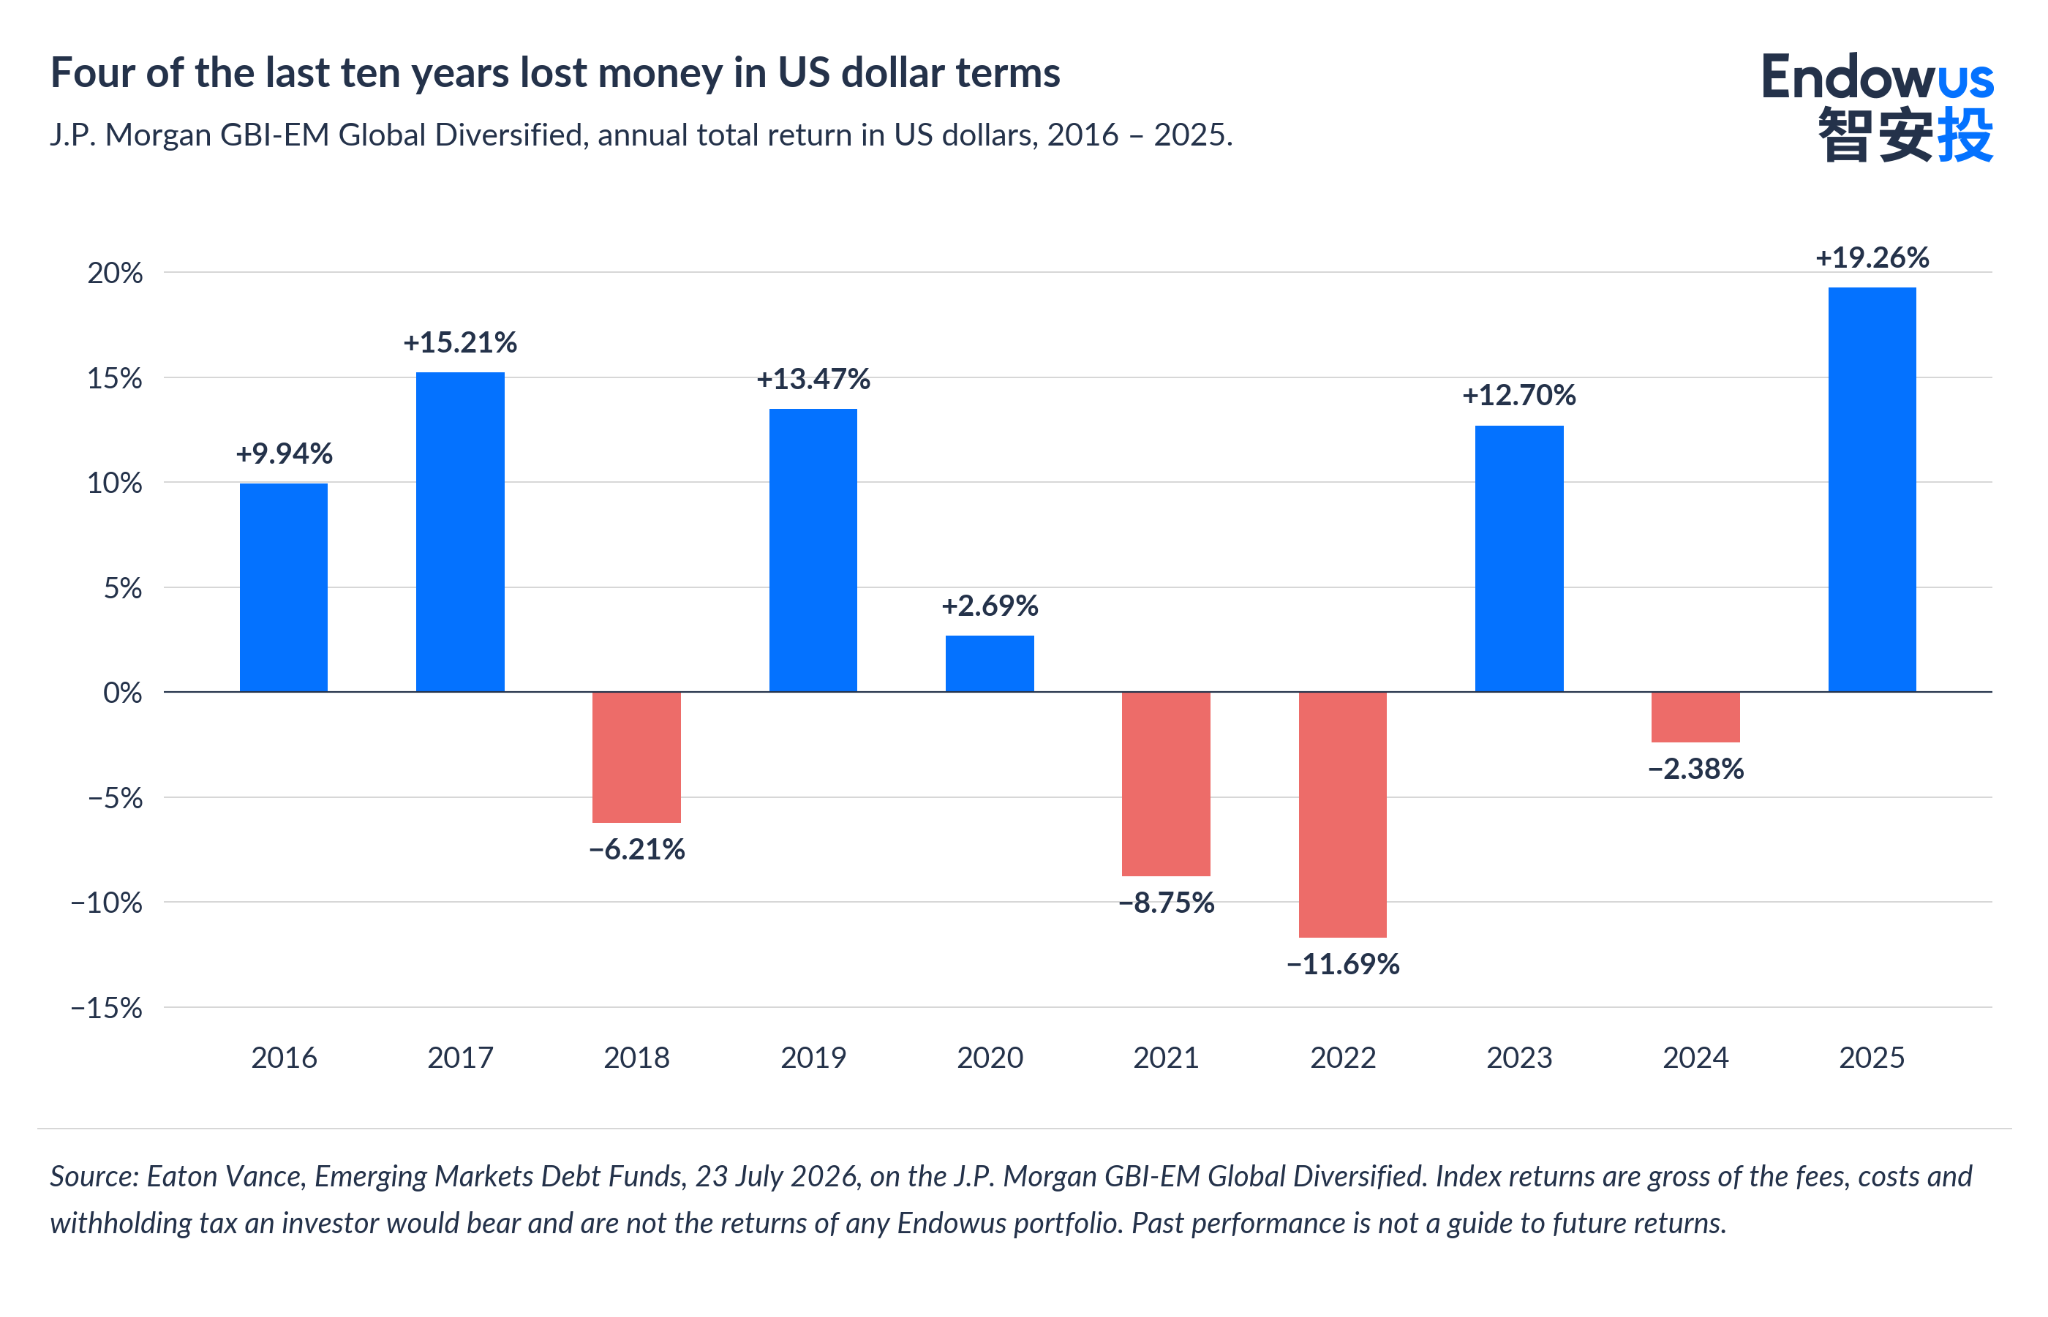
Four of the ten years to 2025 were negative in US dollar terms, and two of them — 2021 and 2024 — were strong years for other asset classes. The 2025 return of +19.26% owed much to a falling dollar: the US dollar index fell 10.8% in the first half of 2025, its worst first half since 1973, and State Street attributed roughly 47% of that year's local currency return to currency alone. When the dollar turned, the index fell 2.25% in the first quarter of 2026 and recovered 3.85% in the second, ending the year to 31 July 2026 up 1.82% — a dead heat with the hard currency index at 1.84%. Past performance is not necessarily a guide to future performance or returns.
Over the long run the figures depend heavily on the window. UBS Asset Management, over 2003 to 2024, put local currency debt at 5.31% annualised with 10.68% volatility, against 6.57% and 8.37% for hard currency sovereigns. State Street, over a near-identical window, put local currency at 3.5% with 6.7% volatility against 5.4% and 6.2%. The two are not reconcilable from the published material, and we would not choose between them; both, however, show local currency debt delivering less return than hard currency with more volatility over roughly two decades.
The clearest way to see what currency does over a long horizon is the index level itself. On a total-return basis the GBI-EM Global Core index stood at 141.72 in April 2012 and did not durably regain that level until April 2025, closing at 164.20 on 31 August 2026 — a cumulative 15.86% over more than fourteen years, or about 1.03% a year, even as the index yielded between roughly 4% and 7% in coupon throughout. Put plainly: over that span, the exchange rate consumed more than all of what local currency debt paid.
Are emerging market central banks moving together?
A common shorthand holds that emerging market central banks are cutting, which would support local bonds. In practice they move both ways. In the second quarter of 2026, Bank Indonesia raised rates three times, by 100 basis points in total, to 5.75%. The Philippine central bank raised twice to 4.75%, and Colombia raised 75 basis points to 12%. In August 2026, Brazil cut 50 basis points to 14%, Mexico cut 25 to 6.50%, and Hungary cut rates down to 5.5%. The Reserve Bank of India and the People's Bank of China held.
The dispersion is visible in the yields on offer, which span an extraordinary range for a single asset class.
Thailand and China both yield less than the US 10-year, a reminder that "emerging market" does not imply a high local interest rate. An investor buying the index buys all of it, weighted by a capping rule rather than by yield or conviction.
What does the Hong Kong dollar peg mean for currency hedging?
This is where a Hong Kong investor's position differs from most. The Hong Kong dollar is pegged to the US dollar under the Linked Exchange Rate System, trading within a band of 7.75 to 7.85 per US dollar. For a Hong Kong dollar-based investor, a US dollar hard currency bond therefore carries little residual currency risk while the peg holds: the two currencies move together within a narrow band. The peg is a long-standing policy commitment rather than a guarantee, and it is worth stating as such — but its practical effect is that the hard-versus-local currency decision looks different from Hong Kong than it does from the eurozone or the United Kingdom.
It also reframes the hedged share class. A currency-hedged share class hedges only the share class against the fund's base currency — the so-called net-asset-value hedge — and does not touch the fund's underlying holdings. If a fund's base currency is the US dollar and it holds Brazilian real, Mexican peso, Indonesian rupiah, and other emerging market currencies, a Hong Kong dollar hedged share class removes only the US dollar to Hong Kong dollar leg. Given the peg, that leg is economically small, so for a Hong Kong investor the hedged-versus-unhedged choice on a US dollar fund matters far less than the underlying emerging market currency exposure — which no share-class hedge removes. In local currency debt, that emerging market exposure is the whole point, and the peg does nothing to soften it.
Two costs sit outside most factsheets. Hedged share class distributions embed the interest rate differential between the two currencies, so a difference in quoted yield between hedged classes reflects rate differentials, not superior income from the bonds. And the local currency indices are calculated gross of withholding tax levied on the underlying bonds — a drag of roughly 35 basis points a year, with Indonesia at about 10% and South Africa at about 15%. For a Hong Kong resident individual, that fund-level tax applies regardless of domicile, even though Hong Kong itself does not, in the ordinary case, tax individuals on investment gains or fund distributions. This is general information, not tax advice; confirm your own position with a tax adviser.
What do both sub-asset classes share right now?
For all their differences, the two sleeves face the same valuation problem in September 2026: thin compensation. J.P. Morgan Global Research described emerging market sovereign spreads as being at 20-year tights on 1 July 2026, with limited room to tighten further, and its base case is for spreads to finish 2026 modestly wider. Fourteen months earlier the same market sat at 433 basis points, the 71st percentile of its ten-year range; the move from historically wide to twenty-year tight happened quickly.
The backdrop is not uniformly cautionary. Emerging market government debt sits just below 60% of GDP on an index-weighted basis, against over 110% for developed markets; corporate net supply has been negative for four consecutive years and is expected to be negative for a fifth; and several sovereigns have regained or are approaching investment grade. Even so, thin spreads leave little room for error, and a supportive macro backdrop does not guarantee that returns improve.
Investment implications
The first decision is not which manager to use. It is which of the two sleeves answers a question you actually have.
The second decision is sizing. Local currency debt has carried roughly 1.7 times as much annualised volatility as its yield, and hard currency debt drew down about 26% at its worst over the two decades to 2024. (Graph) Both are better understood as satellite allocations alongside a core bond holding, not as the core itself. In our view, the case for either sleeve rests less on a market call than on whether its specific risk — US duration on one side, emerging market currencies on the other — is one you actually want in the portfolio.
The third decision is the one most investors overlook: cost. On a strategy whose net excess return over its benchmark has been of the order of one percentage point a year, an ongoing charge of 1% or more is not a detail — and Hong Kong retail fund expense ratios commonly run from 1% to 3%, with trailer fees of 50% to 60% of the expense ratio embedded within them — see Endowus HK: Guide to mutual fund fees in Hong Kong.
Our advisers can help you assess whether emerging market debt suits your goals, time horizon, and risk profile, and at what weight. Endowus Hong Kong offers curated fixed income strategies at institutional share classes with no trailer fees; you can schedule a consultation or explore the fund range on the platform.
On one hand, the rebound in issuance and the return of market access make the asset class easier to own than it has been in years; on the other, spreads at two-decade tights and a currency that has consumed more than a decade of local-currency coupon are a reminder that the entry point, and the sleeve you choose, matter more than the label "emerging market debt."
Frequently asked questions about emerging market debt
What is the difference between hard currency and local currency emerging market debt?
Hard currency debt is issued in a major currency, most often US dollars, so the borrower carries the exchange rate risk and the investor takes US interest rate risk plus emerging market credit risk. Local currency debt is issued in the borrower's own currency, so the investor carries the exchange rate risk and takes emerging market interest rate risk. They use separate benchmarks, admit different countries, and have historically behaved differently.
Which one has performed better?
Over 2003 to 2024, UBS Asset Management put local currency debt at 5.31% annualised with 10.68% volatility, against 6.57% and 8.37% for hard currency sovereigns; T. Rowe Price, over a near-identical window, put local currency at 4.9% with 11.6% volatility against 6.4% and 8.9%. Both show hard currency delivering more return with less volatility over the period. Past performance is not necessarily a guide to future performance or returns.
Why does an emerging market bond index include Saudi Arabia?
Because index providers define "emerging market" by written tests rather than by economic development. The hard currency sovereign index admits countries whose gross national income per capita sits below a ceiling — US$24,325 for 2026 — which is how several Gulf sovereigns qualify.
Does the Hong Kong dollar peg remove my currency risk in emerging market debt?
Only in part, and only for one sleeve. Because the Hong Kong dollar is pegged to the US dollar, a US dollar hard currency holding carries little residual currency risk for a Hong Kong investor while the peg holds. Local currency debt is different: you carry the Brazilian real, Indonesian rupiah, and other emerging market currencies regardless of the peg, and a Hong Kong dollar hedged share class does not remove them — it hedges only the US dollar to Hong Kong dollar leg. Read the share-class hedging disclosure in the offering documents before assuming otherwise.
How much emerging market debt should I hold?
That depends on your objectives, time horizon, existing portfolio, and tolerance for drawdown, and it has no general answer. What the evidence supports is treating it as a satellite allocation rather than a core bond holding: local currency debt has carried roughly 1.7 times as much annualised volatility as its yield. Speak to a financial adviser about your own circumstances.
Disclaimer
Risk Warnings
Investment involves risk. Past performance is not an indicator nor a guarantee of future performance or returns. Projected performance or returns is not guaranteed to materialise. The value of investments and the income from them can go down as well as up, and you may not get the full amount you invested. Rates of exchange may cause the value of investments to go up or down. Individual stock performance does not represent the return of a fund.
General risk warnings relating to collective investment schemes
Before making an investment decision, you are reminded to refer to the relevant prospectus/offering document for specific risk considerations and related fees and charges. Funds are not a bank deposit and not capital guaranteed, and are subject to investment risks, including the possible loss of the principal amount invested. Some of the funds also involve derivatives. Do not invest in them unless you fully understand and are willing to assume the risks associated with them.
Opinions
Any forward-looking statements, prediction, projection or forecast on the economy, stock market, bond market or economic trends of the markets contained in this material are subject to market influences and contingent upon matters outside the control of Endowus HK Limited ("Endowus") and therefore may not be realised in the future. Further, any opinion or estimate is made on a general basis and subject to change without notice. In presenting the information above, none of Endowus HK Limited, its affiliates, directors, employees, representatives or agents have given any consideration to, nor have made any investigation of the objective, financial situation or particular need of any user, reader, any specific person or group of persons. Therefore, no representation is made as to the completeness and adequacy of the information to make an informed decision. You should carefully consider whether any investment views and products/services are appropriate in view of your investment experience, objectives, financial resources and relevant circumstances. You may also wish to seek financial advice through a financial advisor or the Endowus platform and independent legal, accounting, regulatory or tax advice, as appropriate.
No invitation or solicitation
Nothing contained in this article should be construed as a solicitation, an offer to buy or sell, or recommendation, to acquire or dispose of any security, commodity, investment or to engage in any other transaction in any jurisdiction in which such solicitation, offer to buy or sell would be unlawful under the securities laws in such jurisdiction. No information included in this article is to be construed as investment advice or as a recommendation or a representation about the suitability or appropriateness of any advisory product or service; or an offer to buy or sell, or the solicitation of an offer to buy or sell, any security, financial product, or instrument; or to participate in any particular trading strategy. Investors should seek independent financial and tax advice before making any investment decision.
Product Risk Rating
Please note that any product risk rating (the "PRR") provided by us is an internal rating assigned based on our product risk assessment model, and is for your reference only. The PRR is subject to change from time to time. The PRR does not take into account your individual circumstances, objectives or needs and should not be regarded as advice or recommendation to purchase, hold or sell any fund or make any other investment decisions. Accordingly, you should not solely rely on the PRR in making your investment decision in the relevant Fund.
This advertisement has not been reviewed by the Securities and Futures Commission or any regulatory authority in Hong Kong.
Endowus HK Limited is licensed by the Securities and Futures Commission (CE No. BQR225) for Type 1 (Dealing in Securities), Type 4 (Advising on Securities), and Type 9 (Asset Management) regulated activities.


.png)