.webp)
.webp)
.webp)
.webp)





.jpg)
- The Hang Seng Index (HSI) has delivered a price compound annual growth rate (CAGR) of approximately 8.9% in HKD terms from April 1974 to April 2026—competitive with global peers in nominal terms, but accompanied by annualised volatility of approximately 28%, nearly double that of the S&P 500.
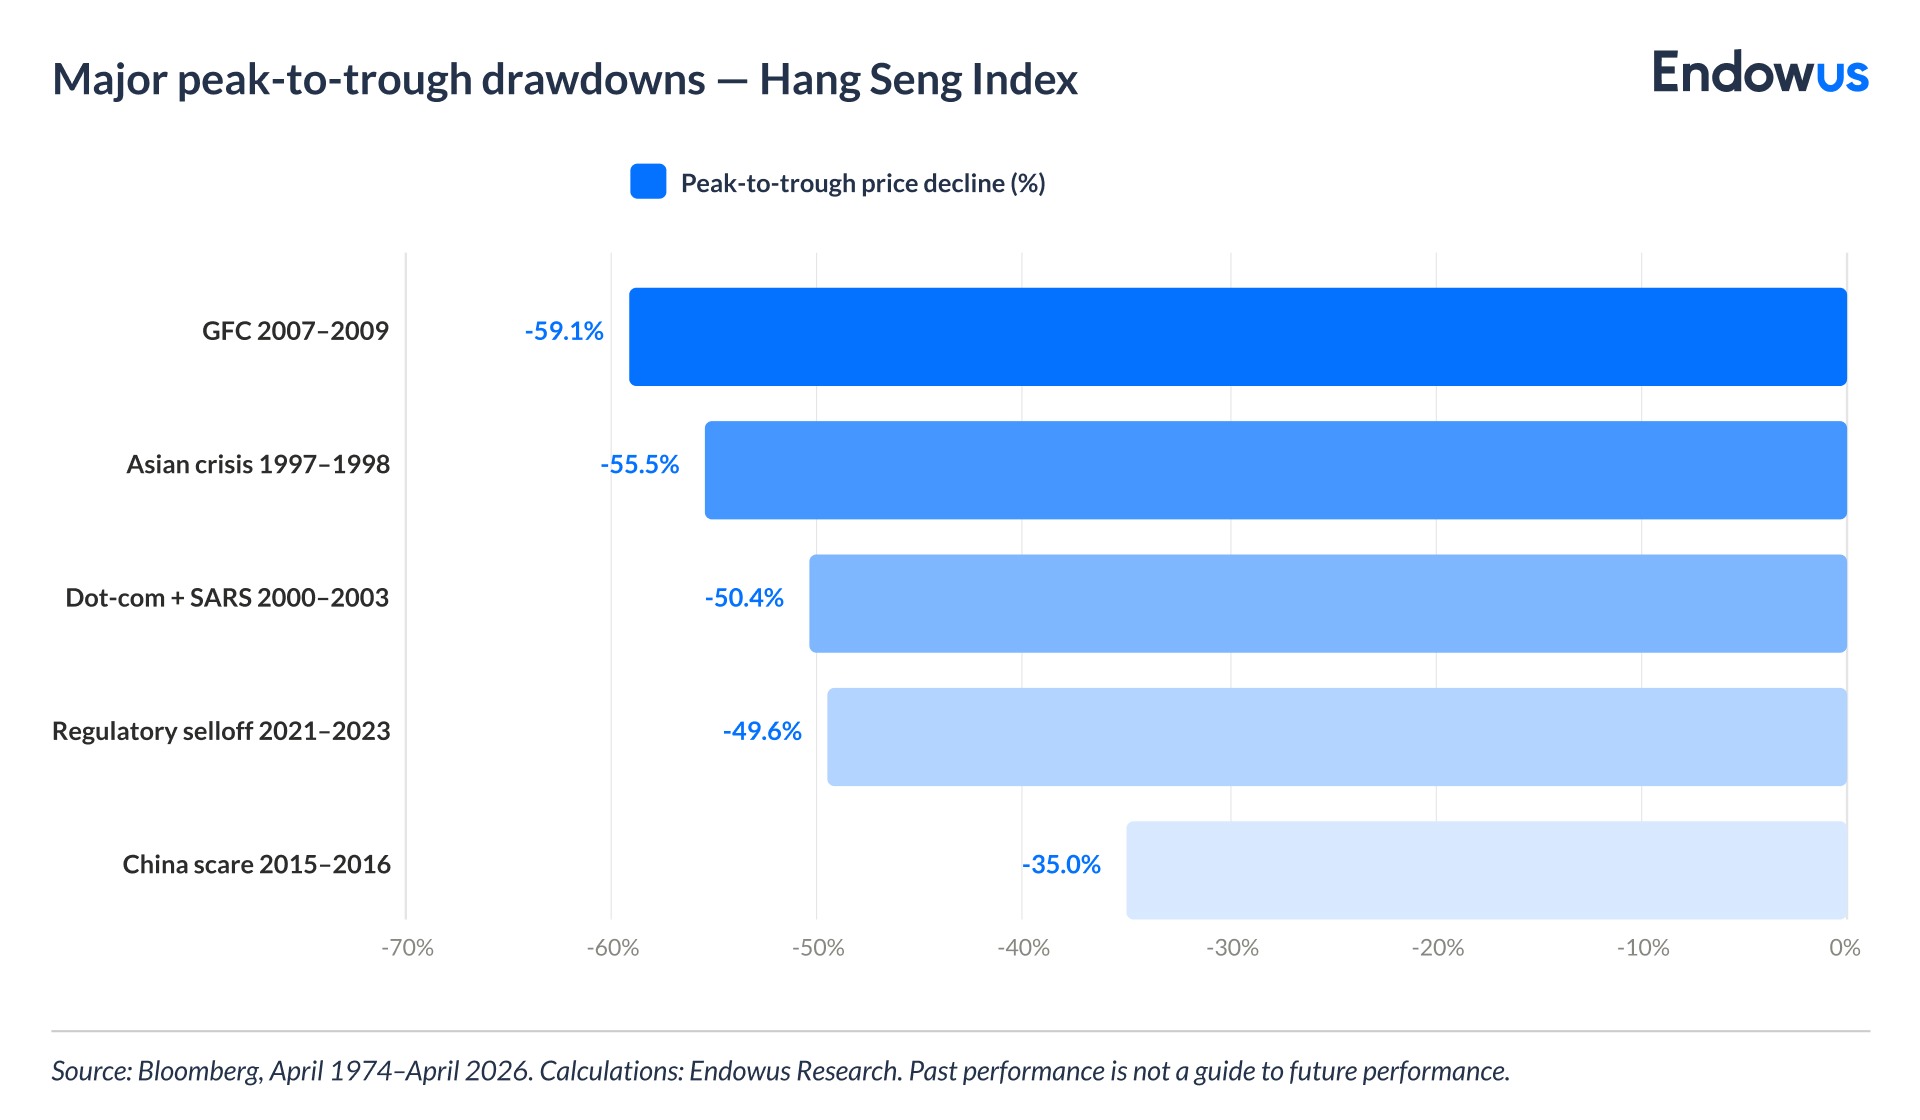
- The HSI has suffered five severe peak-to-trough drawdowns—driven by the 1997 Asian financial crisis, the 2000–2003 dot-com and SARS period, the 2007–2009 global financial crisis, the 2015–2016 China scare, and the 2021–2023 regulatory and property selloff—with long recovery timelines.
- For investors with a sufficiently long horizon, the HSI's historically high dividend yield and current valuation discount to global peers may represent a forward return premium—but sizing, time horizon, and genuine loss tolerance must be assessed honestly before including Hong Kong equities in a portfolio.
The Hang Seng Index ("HSI")—Hong Kong's most widely quoted market gauge—has rewarded patient investors with a price CAGR of close to 9% in HKD terms over 52 years, but that return has come packaged with high volatility, and periodic drawdowns that have exceeded 50% on multiple occasions.
This article examines the HSI's long-run return and volatility record using Bloomberg data from April 1974 to April 2026. It covers annual returns, drawdown episodes, and rolling-period return dispersion. The aim is not to make a market call, but to equip investors with the factual foundation they need to correctly size their Hong Kong equity exposure.
What does the Hang Seng Index measure?
The HSI was launched on 24 November 1969 by HSI Services Limited (now Hang Seng Indexes Company Limited), a subsidiary of Hang Seng Bank. It tracks the largest and most liquid companies listed on the Hong Kong Stock Exchange, currently comprising 90 constituent stocks with a total market capitalisation of close to HK$32 trillion.
The index is free-float adjusted and market-capitalisation weighted. Free-float adjusted means that only shares available for public trading are counted when calculating a company's index weight — shares held by governments, founders, or strategic investors who are unlikely to sell are excluded. Market-capitalisation weighted means that larger companies exert a proportionally greater influence on the index's movement.
Its constituents span financials, technology, consumer, energy, and property sectors — with significant exposure to large mainland Chinese companies listed in Hong Kong. In practice, the HSI functions as a proxy for Greater China corporate exposure, accessed through a market governed by Hong Kong's legal and regulatory framework. An 8% single-stock cap prevents any one company from dominating index movements, though the top ten holdings still account for close to 50% of total weight.
How has the Hang Seng Index performed over the long run?
From April 1974 to April 2026, the HSI delivered a price CAGR of 8.9% in HKD terms. The HSI Total Return Index, which includes dividend reinvestment, stood at 92,453 at end-April 2026 on its rebased series, implying a materially higher total return CAGR once dividends are included.
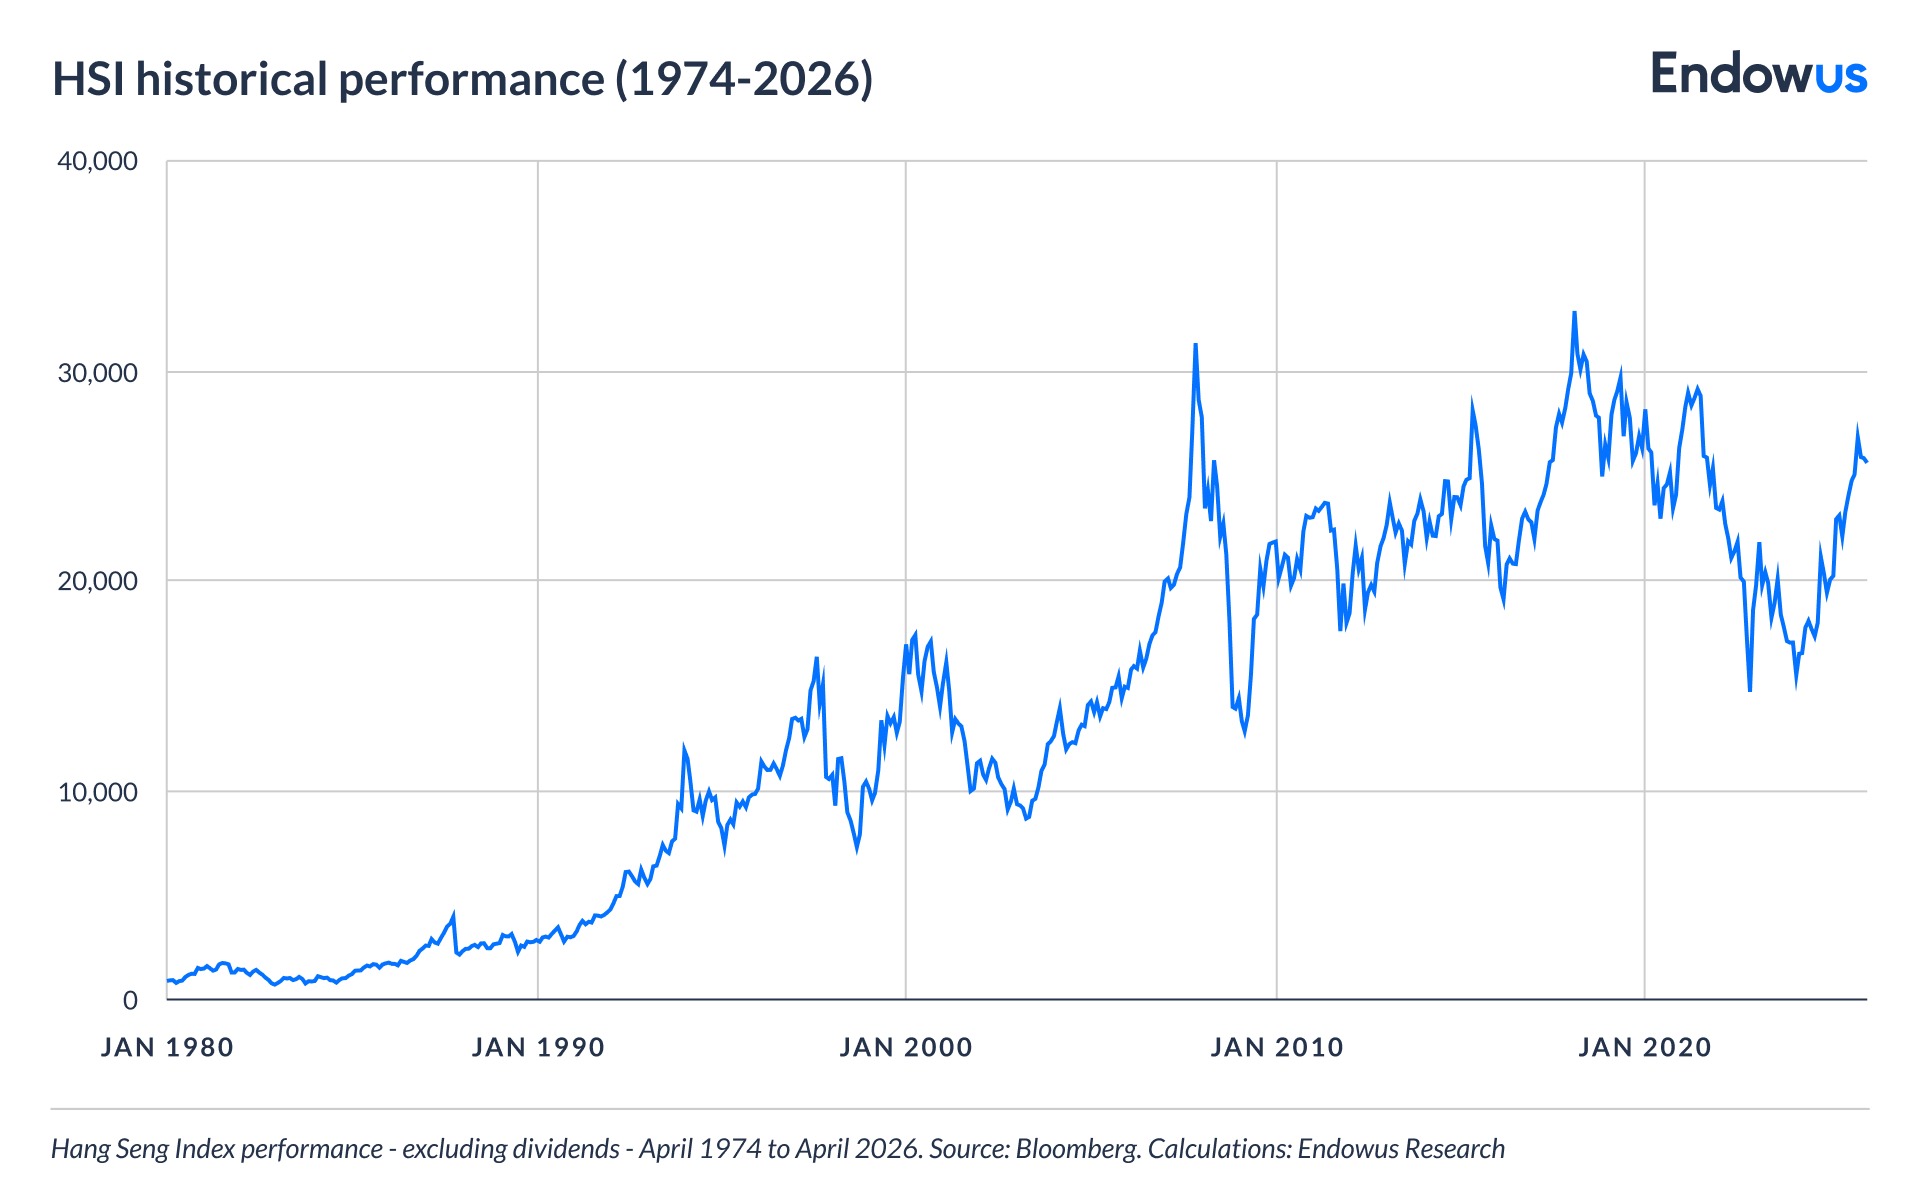
For context, the S&P 500 delivered a total return CAGR of approximately 8.8% in USD (excluding dividends) terms over a comparable period. The HSI's nominal price return has been broadly similar to developed market peers, though with a substantially different risk profile—discussed below.
The distribution of HSI returns is highly uneven. The index's best calendar year was 1993, when it rose 115.7%. Its worst was 2008, when it fell 48.3%—a large swing for a diversified index. In the decade of the 1990s, the index gained over 600% in price terms. In the 2010s, by contrast, it ended the decade roughly flat in price terms. This return dispersion is a defining feature of the HSI's character as an investment.
Is Hang Seng Index volatility elevated by global standards?
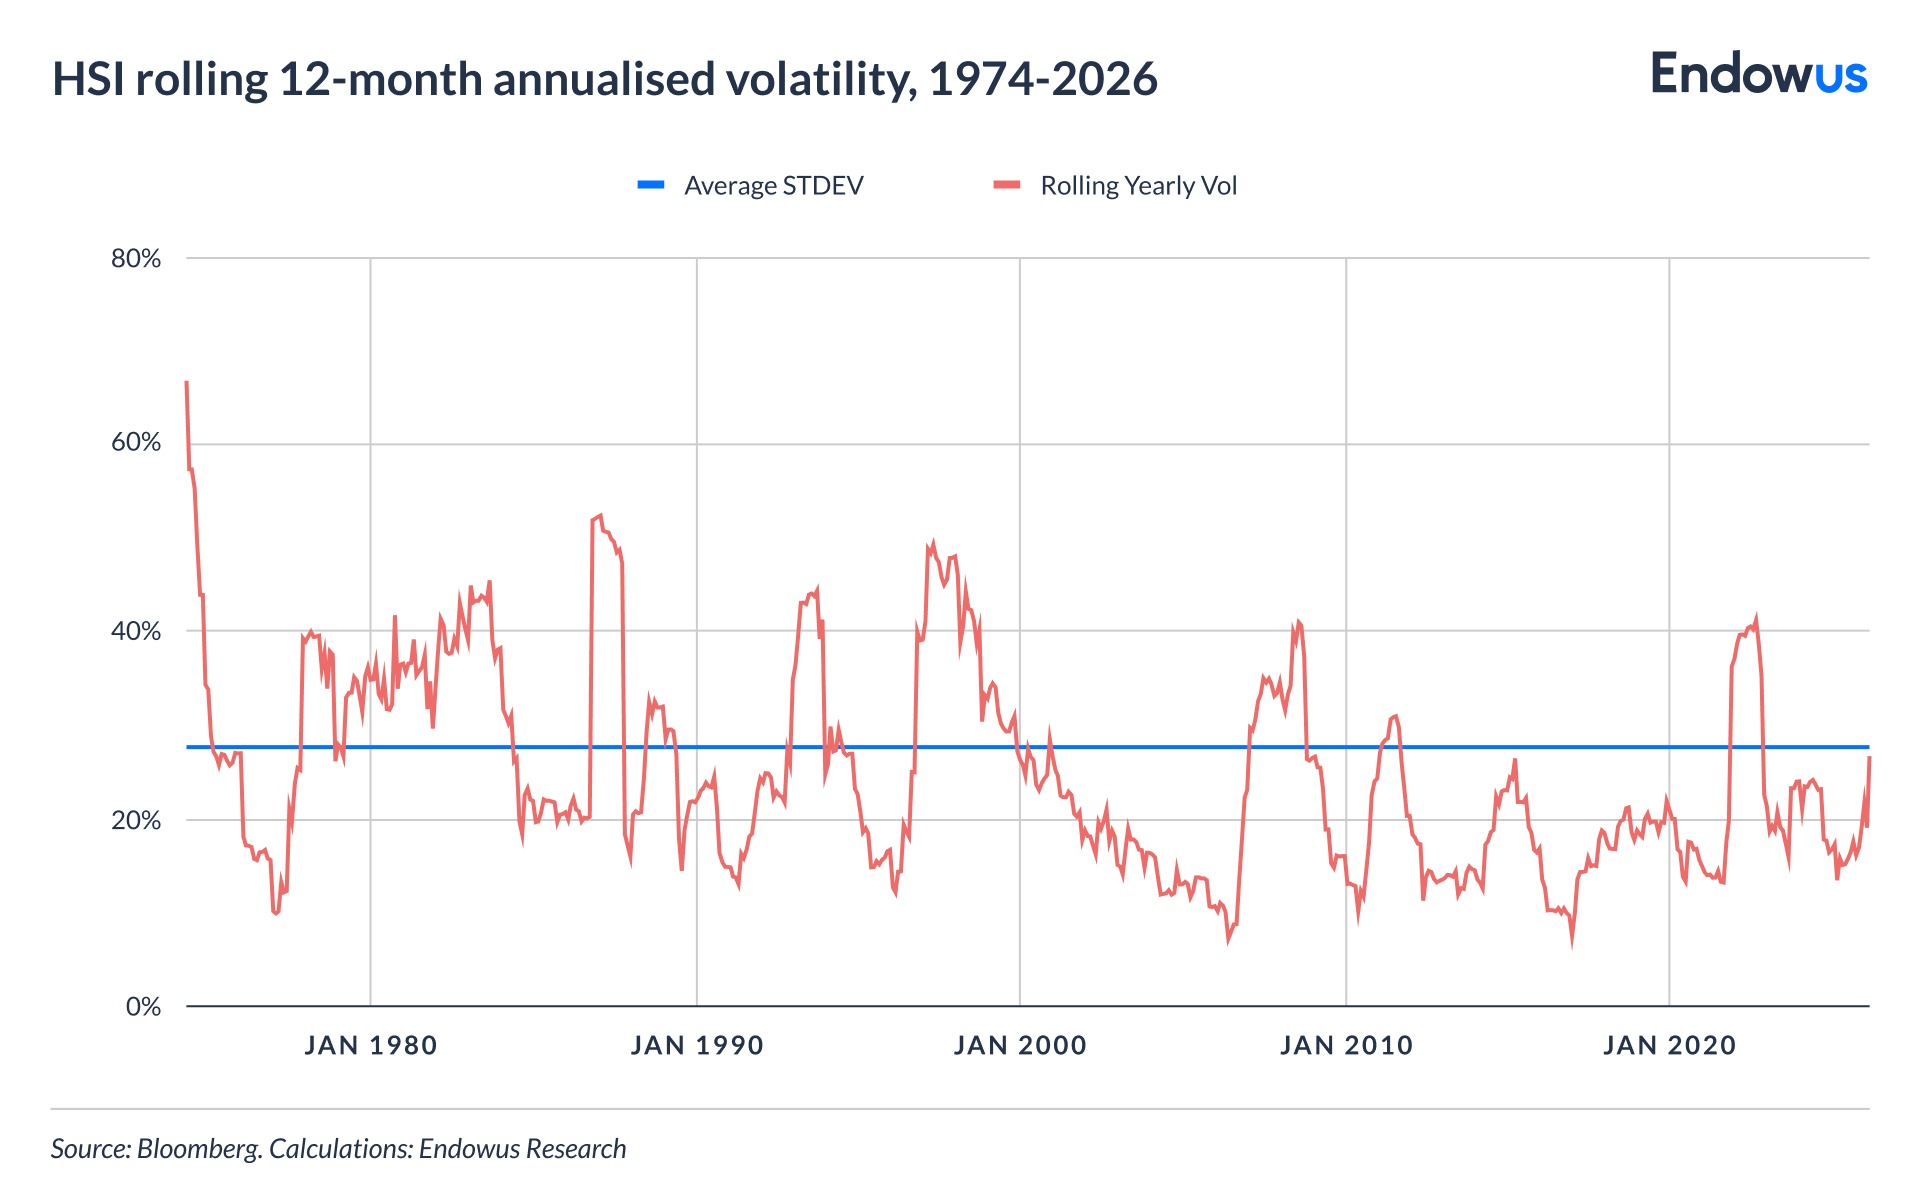
Based on monthly Bloomberg data from April 1974 to April 2026, the HSI's annualised price volatility has averaged approximately 27.7% over the full period. Over the more recent 2000–2026 window, it has averaged approximately 21.2%—reflecting the somewhat calmer conditions of the 2003–2006 and 2010–2016 periods, offset by the acute spikes seen in 1997–1998, 2008, and 2022.
For comparison, the S&P 500's annualised volatility has averaged approximately 15% over the 1974-2026 period. The HSI therefore shows higher variability of returns.
Several structural factors drive this elevated volatility. First, the index is concentrated—though this feature is becoming increasingly common. The top ten constituents account for close to 50% of index weight. Second, a substantial share of the index comprises mainland Chinese companies, where policy risk—including regulatory shifts, property sector stress, and geopolitical developments—can trigger rapid repricing. Third, Hong Kong's currency peg to the US dollar means local monetary conditions track US interest rate cycles, which can amplify macro shocks.
What is the HSI’s long-term risk profile?
Volatility statistics summarise dispersion but do not convey the texture of living through a major drawdown. The HSI's history includes five severe peak-to-trough declines that investors need to understand before sizing an allocation.
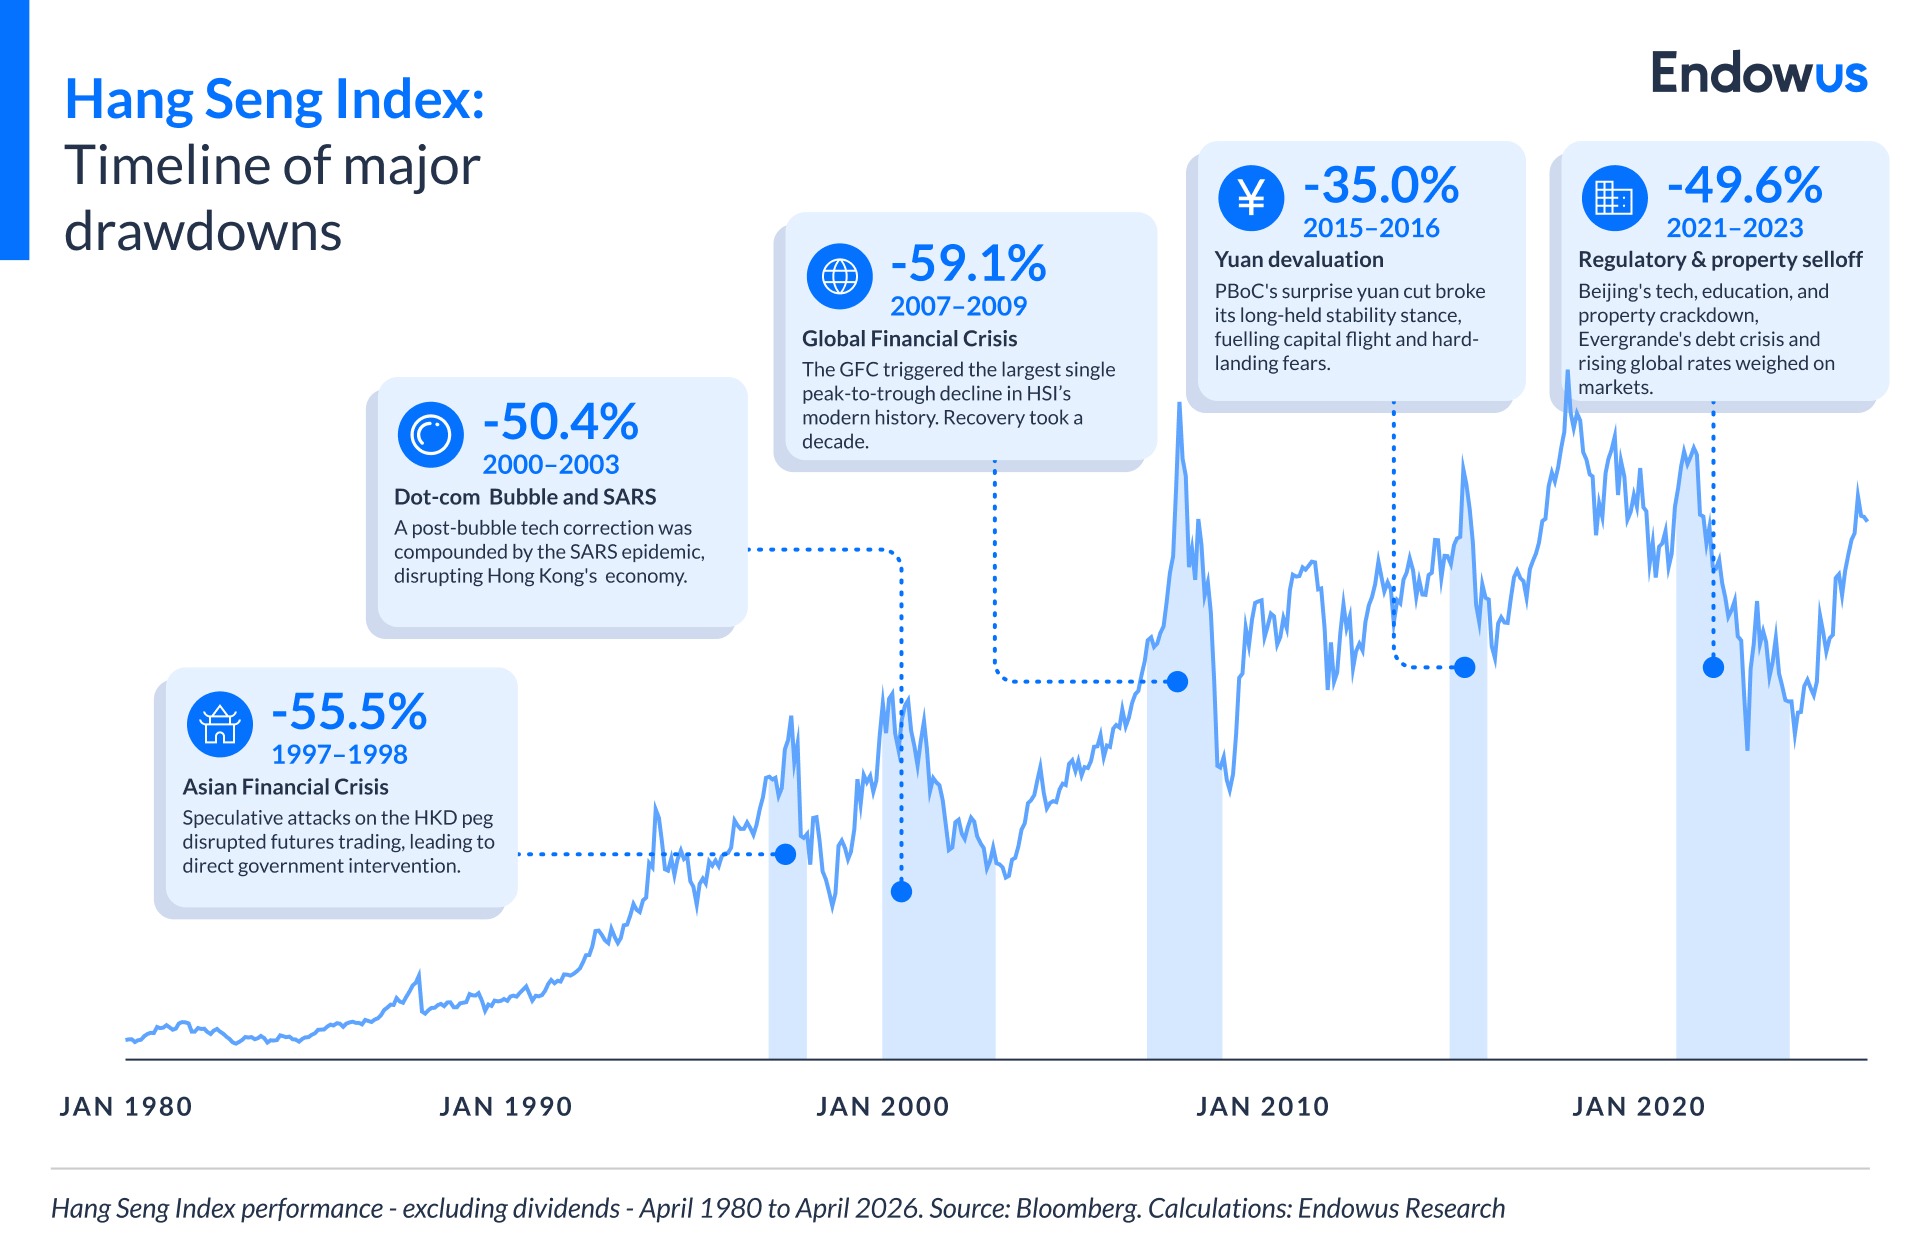
- The 1997–1998 Asian financial crisis saw the HSI fall approximately 55.5% from its July 1997 peak of 16,366 to its August 1998 trough of 7,275. The HKD peg came under sustained speculative attack, and futures trading was severely disrupted. The Hong Kong government intervened directly in equity markets, purchasing HK$118 billion of constituent stocks — a controversial but ultimately stabilising move.
- The 2000–2003 dot-com and SARS period produced a cumulative peak-to-trough decline of approximately 50.4%—from the March 2000 high of 17,407 to the March 2003 trough of 8,634. The SARS epidemic of 2003 compounded what was already a painful post-bubble correction, causing severe disruption to Hong Kong's service-oriented economy.
- The 2007–2009 global financial crisis (GFC) produced the largest single peak-to-trough decline in the HSI's modern history: –59.1% from the October 2007 peak of 31,353 to the February 2009 trough of 12,812. The worst single calendar year was 2008 (–48.3%). Recovery to the pre-crisis peak in price terms took until 2018—a decade.
- The 2015–2016 episode, triggered by China's surprise yuan devaluation and hard-landing fears, saw the HSI fall approximately 35% from its April 2015 peak to its February 2016 trough.
- The 2021–2023 regulatory and property selloff was structurally distinct. It was driven primarily by Beijing's crackdown on technology, education, and property sectors, compounded by Evergrande's debt crisis and rising global interest rates. The HSI fell approximately 49.6% from its May 2021 peak of 29,152 to its October 2022 trough of 14,687. Three consecutive years of negative price returns (2021: –14.1%, 2022: –15.5%, 2023: –13.8%) tested investor resolve. A meaningful recovery followed in 2024 (+17.7%) and 2025 (+27.8%).
What do risk-adjusted returns tell us about the HSI?
Raw return figures can mislead when comparing assets with different volatility profiles. The Sharpe ratio—which measures return earned per unit of risk, using the risk-free rate as the baseline—provides a more useful comparison across market indices.
Over the past decade, the HSI had a 0.11 Sharpe ratio, partly a function of timing: the decade from 2015 to 2024 was marked by the 2021–2023 drawdown and a series of policy headwinds for China-exposed names.
However, it would be an oversimplification to conclude that the HSI is a poor risk-adjusted bet in all contexts. For Hong Kong-based investors, a meaningful portion of the volatility is correlated with local economic conditions—including housing prices and employment—meaning that global diversification away from the HSI may not reduce total household risk as much as a simple number suggests.
There is also a valuation dimension. The HSI has historically traded at a significant discount to global peers. As of April 2026, the factsheet shows the index at a price-to-earnings ratio of 14.1 times—roughly half the multiple of the S&P 500. For investors with a sufficiently long horizon and genuine tolerance for the volatility profile documented here, that discount may represent a potential return premium over time.
A further dimension worth monitoring is the ongoing push to improve corporate governance standards among HSI constituents. HKEX finalised amendments to its Corporate Governance Code and Listing Rules in December 2024, with the new rules taking effect on 1 July 2025. The reforms focus on board effectiveness and independence, risk management and internal controls, and capital management.
The reform introduced a hard cap of six listed company directorships for independent non-executive directors. For investors, these reforms matter because weak board oversight has historically been cited as a discount factor for Hong Kong and China-exposed equities.
To the extent that the reforms improve accountability and capital allocation discipline among HSI constituents over time, they may contribute to a gradual re-rating — though the impact on valuations will take years to assess.
How wide is the range of outcomes across different holding periods?
One of the most important and underappreciated features of the HSI's return history is the extreme dispersion between its best and worst periods—and the implications this carries for minimum investment horizon requirements.
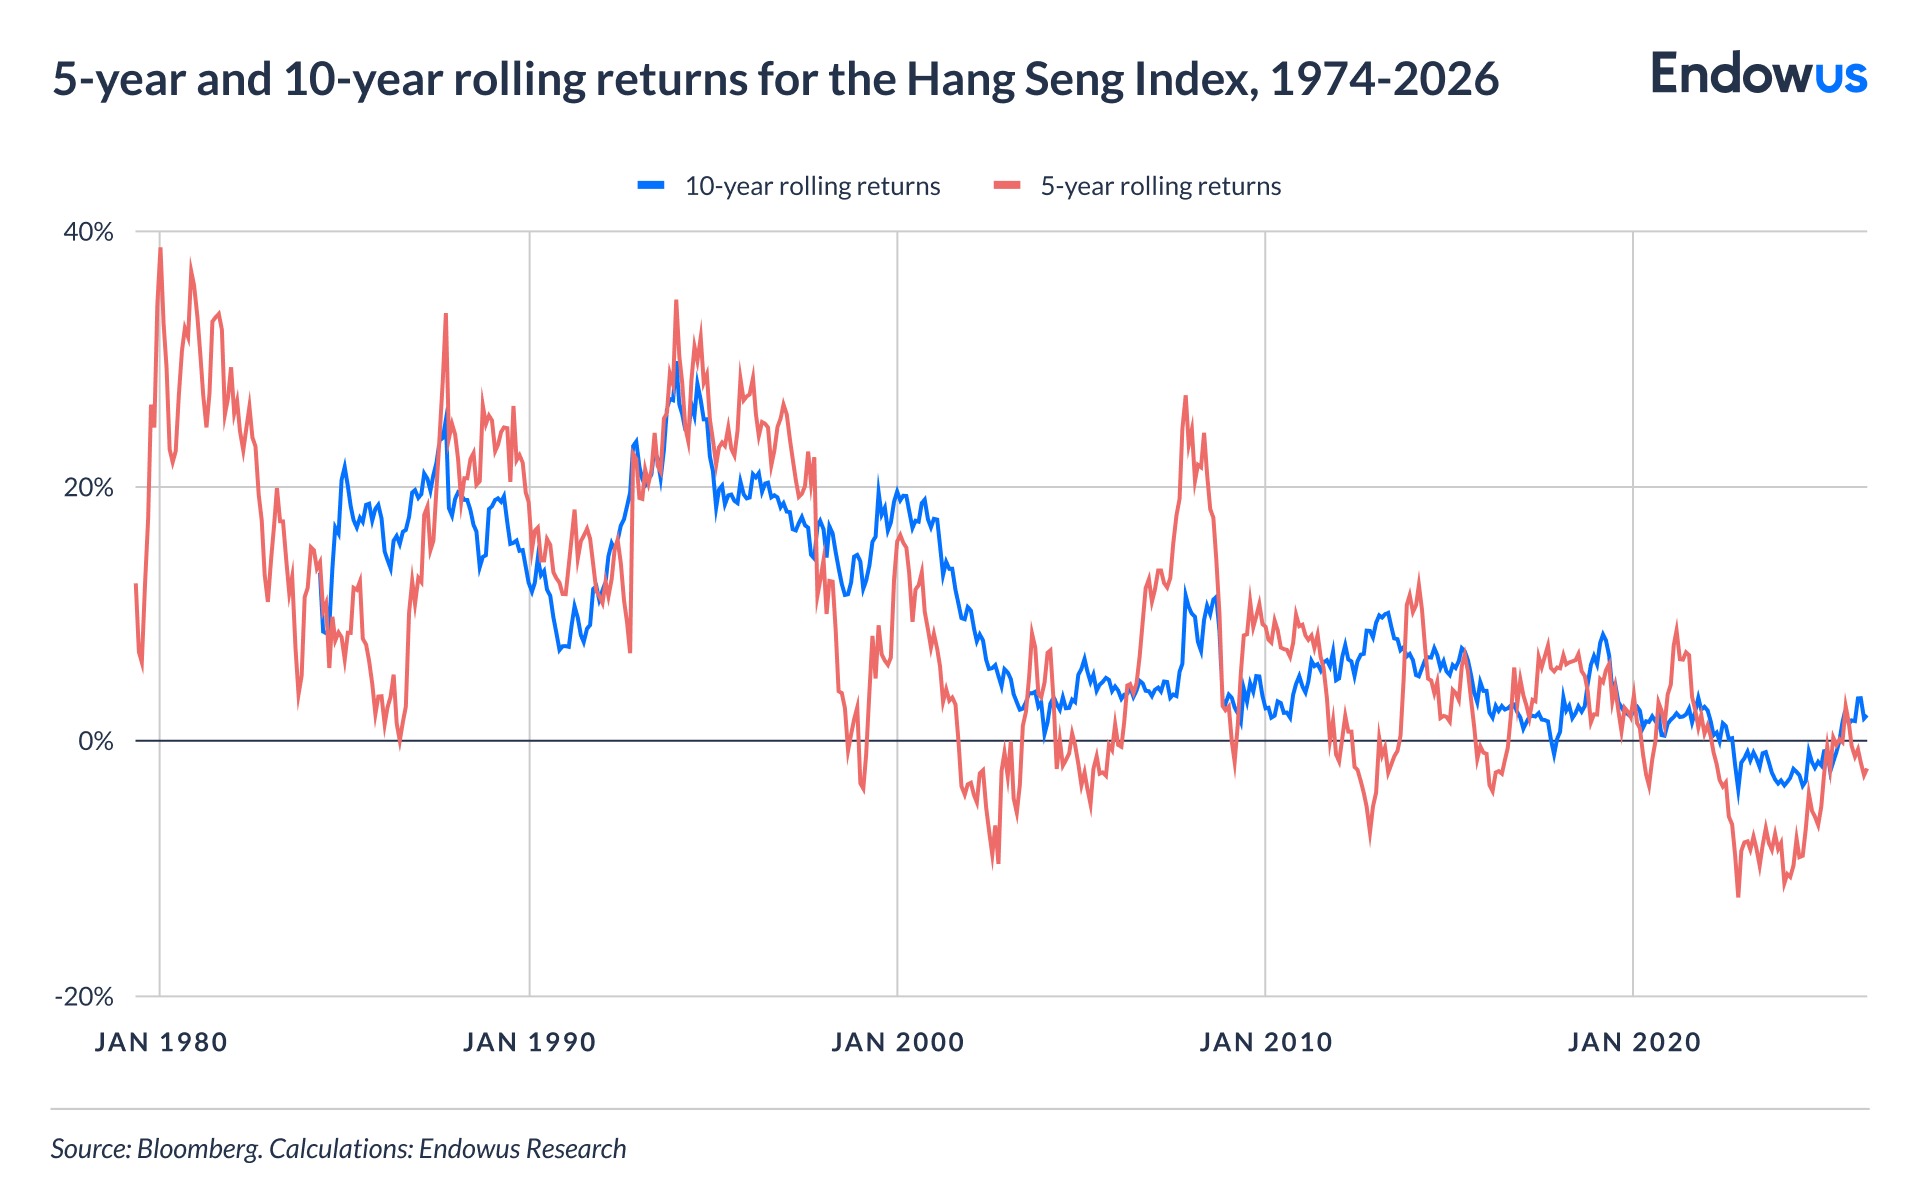
Over any rolling five-year window from 1979 to 2026, the HSI's annualised price return in HKD terms has ranged from approximately –12.3% per year at the worst to approximately +38.7% per year at the best. The median five-year annualised return has been approximately +7.3%. This standard deviation of outcomes is itself higher than the long-run annualised return—a reminder that sequence-of-returns risk is a genuine planning concern for HSI investors.
Over rolling 10-year windows, the range narrows substantially. The worst 10-year rolling period produced approximately –3.8% annualised; the best produced approximately +29.8% annualised. The median 10-year return has been approximately +6.8% annualised in price terms, with total returns (including dividends) higher.
What does the Hang Seng Index's dividend yield contribute to total return?
One aspect of the HSI's return profile that receives insufficient attention is the contribution of dividends. The index has consistently offered a dividend yield significantly higher than most developed market benchmarks.
The April 2026 factsheet shows a trailing dividend yield of 3.04%—consistent with the index's historical range of approximately 2.5% to 4.5% over the 2000–2026 period. By comparison, the S&P 500's dividend yield is currently 1.1%.
In compounding terms, this difference is substantial. An investor who reinvested dividends in the HSI consistently would have received a meaningfully higher total return than the price-only figure suggests. Over any 20-year holding period, the gap between price-only and total-return outcomes is estimated at 70 to 90 percentage points cumulatively, depending on the start date—a reminder that the HSI's total return story looks materially better than its price chart alone implies.
This matters particularly for income-oriented investors. The HSI's yield profile has historically made it a meaningful contributor to income strategies—even in periods when price appreciation was subdued.
What does the data mean for portfolio construction?
The HSI's 52-year record presents investors with a clear picture: competitive long-run returns, elevated volatility relative to developed market alternatives, and periodic drawdowns that have required genuine investor patience. Translating this into portfolio construction principles requires addressing three questions.
- How much HSI exposure is appropriate? Given the elevated annualised volatility, sizing matters significantly. An allocation large enough to move portfolio outcomes in a strong year is also large enough to cause material distress in a down year.
- What is the appropriate time horizon? The rolling-return data suggests a minimum horizon of 10 years to have a high probability of a positive total return outcome. For investors with shorter required liquidity windows, the risk profile becomes less favourable.
- How does currency factor in? For investors whose liabilities and spending are denominated in HKD, the HSI provides a natural currency match. For investors with SGD, USD, or other currency obligations, Hong Kong's currency peg to the US dollar provides a degree of stability—but does not eliminate currency risk relative to non-USD functional currencies.
Investment implications
Hong Kong equities have historically rewarded investors who could stay invested through periods of severe drawdown. The HSI's long-run price CAGR of 8.9% in HKD terms—with total returns materially higher once dividends are included—is competitive with major equity benchmarks globally. Its dividend yield, consistently higher than developed market peers, has been a meaningful contributor to total return. And its current valuation, at a significant discount to global indices, may imply a forward return premium for patient investors.
The risk embedded in the HSI is real and must be quantified honestly. Elevated annualised volatility means investors should plan for potentially large interim losses. The five major drawdowns documented here—each exceeding 49% in peak-to-trough terms—should be kept into account when assessing an investor’s risk tolerance.
For investors accessing Hong Kong equities, the HSI should be part of a broader, globally diversified equity allocation. The decision to include it should be driven by an honest assessment of investment horizon, liquidity needs, and genuine loss tolerance.
Understanding what you own—including its full historical return, volatility, and drawdown record—is the starting point for every sound investment decision.
Customise your portfolio in minutes with Endowus Fund Smart
For those seeking exposure to the Hong Kong equities market, the iShares Hong Kong Equity Index Fund, managed by BlackRock, provides investors with passive and low cost exposure to the FTSE MPF Hong Kong Index. It holds over 300 Mandatory Provident Fund (MPF)-approved equities, providing diversified exposure to large and mid-cap companies, and Hong Kong-listed Chinese securities.
This fund is available on Endowus Fund Smart, our fund platform that offers flexibility for investors to customise and diversify their investment portfolios at the lowest fees possible. It features over 300 funds that have undergone rigorous assessments of the investment firms, fund managers, framework, process and performance, and continue to be regularly monitored by our Investment Office.
Frequently Asked Questions
What is the long-run price return of the Hang Seng Index?
From April 1974 to April 2026, the HSI delivered a price CAGR of approximately 8.9% in HKD terms, based on Bloomberg monthly data. Total returns, including dividends reinvested, are materially higher—the HSI's trailing dividend yield has historically ranged between 2.5% and 4.5%, adding meaningfully to compounded outcomes over long holding periods. Past performance is not necessarily a guide to future performance or returns.
How volatile is the Hang Seng Index compared to the S&P 500?
The HSI's annualised price volatility has averaged approximately 27.7% over the full 1974–2026 period. By comparison, the S&P 500's volatility has averaged approximately 15% over the same period—making the HSI roughly twice as volatile. Several structural factors drive this gap: index concentration, significant mainland China policy exposure, and Hong Kong's currency peg to the USD, which ties local monetary conditions to US interest rate cycles.
What were the HSI's worst drawdowns?
The index has suffered five severe peak-to-trough declines exceeding 35%: the 1997–1998 Asian financial crisis (–55.5%), the 2000–2003 dot-com and SARS period (–50.4%), the 2007–2009 global financial crisis (–59.1%), the 2015–2016 China scare (–35%), and the 2021–2023 regulatory and property selloff (–49.6%). Recovery timelines have been long—following the 2008 GFC drawdown, the index did not reclaim its prior peak in price terms until 2018, a decade later.
What was the worst single-year return for the Hang Seng Index?
The worst calendar-year price return was 2008, when the HSI fell 48.3%, driven by the global financial crisis. The 2021–2023 period was notable for a different reason: three consecutive years of negative returns (–14.1%, –15.5%, and –13.8% respectively), which cumulatively tested even long-term holders.
How wide is the range of outcomes across different holding periods?
Over rolling five-year windows, the HSI's annualised price return has ranged from approximately –12.3% at the worst to +38.7% at the best, with a median of approximately +7.3%. Over rolling 10-year windows, the range narrows to approximately –3.8% at the worst and +29.8% at the best. Investors should note that negative 10-year and even 15-year rolling returns have occurred — particularly for those who entered near the 2007 pre-GFC peak — underscoring the importance of entry point and investment horizon.
What dividend yield does the Hang Seng Index typically offer?
The trailing dividend yield as of April 2026 was 3.04%, consistent with a historical range of approximately 2.5% to 4.5% over the 2000–2026 period. This is materially higher than the S&P 500's average yield of approximately 1.8% over the same period. Over a 20-year holding period, the cumulative gap between price-only and total return outcomes is estimated at 70 to 90 percentage points—a reminder that the HSI's total return story looks considerably better than its price chart alone implies.
Is the Hang Seng Index suitable for my portfolio?
That depends on three factors: time horizon, loss tolerance, and currency. The rolling-return data suggests longer time horizons may offer stronger odds of positive returns. Given elevated volatility, sizing matters—an allocation large enough to meaningfully contribute in a strong year is also large enough to cause material distress in a down year. For investors with SGD, USD, or other non-HKD obligations, Hong Kong's currency peg provides a degree of stability but does not eliminate currency risk. The HSI may be treated as part of a broader, globally diversified equity allocation.
Sources: Bloomberg Terminal, April 1974 – April 2026, HSI Index (PX_LAST, monthly). Hang Seng Indexes Company Limited factsheet, April 2026. Calculations: Endowus Research.
<divider><divider>
Risk Warnings
Investment involves risk. Past performance is not an indicator nor a guarantee of future performance. The value of investments and the income from them can go down as well as up, and you may not get the full amount you invested. Rates of exchange may cause the value of investments to go up or down.
This article is not intended to be relied upon as a forecast or research or investment advice, and should not form the basis of any investment or other decisions. The information contained herein is not intended, and should not be construed, as any legal, tax, regulatory, accounting or financial advice. If you would like investment, accounting, tax or legal advice, you should consult with your own professional advisors regarding your individual circumstances and needs.
The information in this article may not be suitable for all investors. You are responsible for any action that you take or decision that you make in reliance on any content in this article, and you agree that Endowus HK Limited (“Endowus”) is not liable under any circumstances.
No invitation or solicitation
Neither the information, nor any opinion, contained in this article constitutes a recommendation, offer or solicitation by Endowus or its affiliates to you to buy or sell any securities, collective investment schemes or other financial instruments or services, nor shall any such security, collective investment scheme, or other financial instruments or services be offered or sold to any person in any jurisdiction in which such offer, solicitation, purchase, or sale would be unlawful under the securities laws of such jurisdiction.
This is not intended to be an invitation or offer made to the public to subscribe for any financial product or to enter into any transaction.
Accuracy of Information
Whilst Endowus has made reasonable efforts to provide accurate and timely information, there may be inadvertent delays, omissions, technical or factual inaccuracies or errors in any such information. Endowus does not warrant or represent that the information in this article is correct, accurate or reliable.
Opinions
Any opinion or estimate above is made on a general basis and none of Endowus, nor any of its affiliates, representatives or agents have given any consideration to nor have made any investigation of the objective, financial situation or particular need of any user, reader, any specific person or group of persons. Opinions expressed herein are subject to change without notice.
Any forward-looking statements, prediction, projection or forecast on the economy, stock market, bond market or economic trends of the markets contained in this article are subject to market influences and contingent upon matters outside the control of Endowus and therefore may not be realised in the future.
In presenting the information above, none of Endowus, its affiliates, directors, employees, representatives or agents have given any consideration to, nor have made any investigation of the objective, financial situation or particular need of any user, reader, any specific person or group of persons. Therefore, no representation is made as to the completeness and adequacy of the information to make an informed decision. You should carefully consider whether any investment views and products/ services are appropriate in view of your investment experience, objectives, financial resources and relevant circumstances.
This article has not been reviewed by the Securities and Futures Commission of Hong Kong.


.png)