.webp)
.webp)
.webp)
.webp)


- Geopolitical shocks & inflation: The Q1 2026 US-Iran conflict disrupted global energy supplies, driving oil near $110/bbl and halting expected Federal Reserve rate cuts.
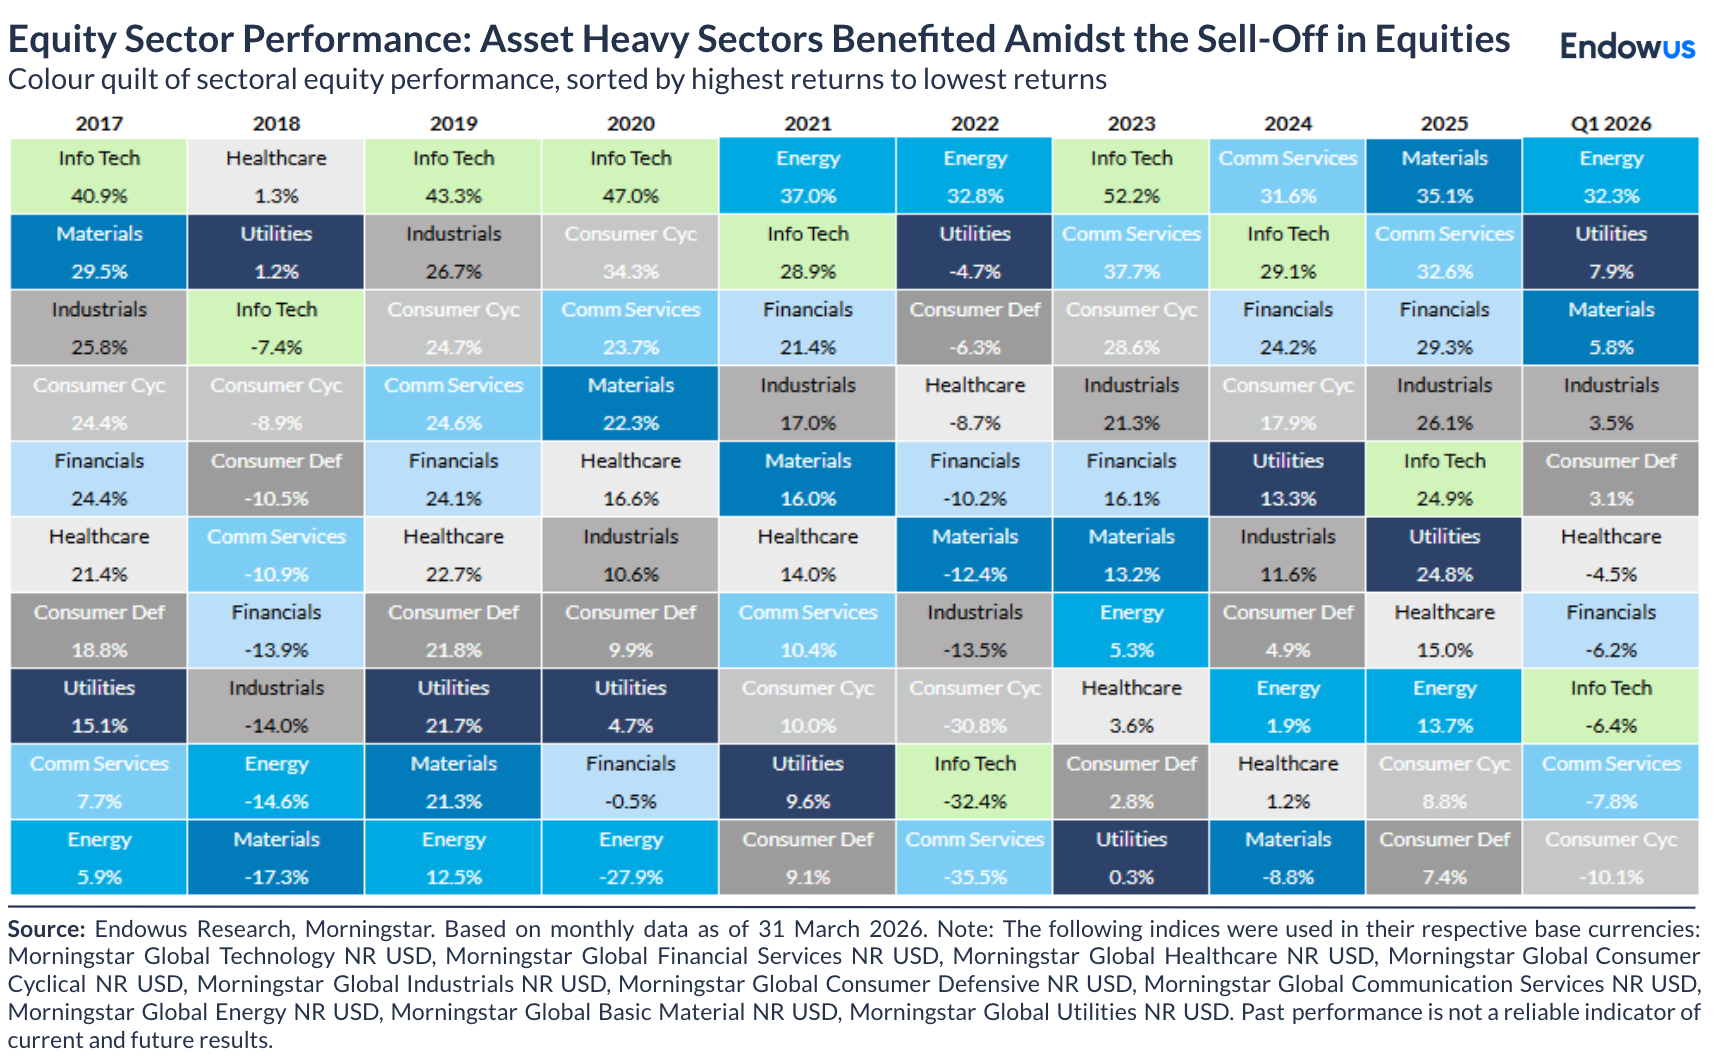
- Tech rotation & energy gains: While "Magnificent 7" tech stocks dragged down US markets, the energy sector (+32%), defensive equities, and non-US markets offered significant outperformance.
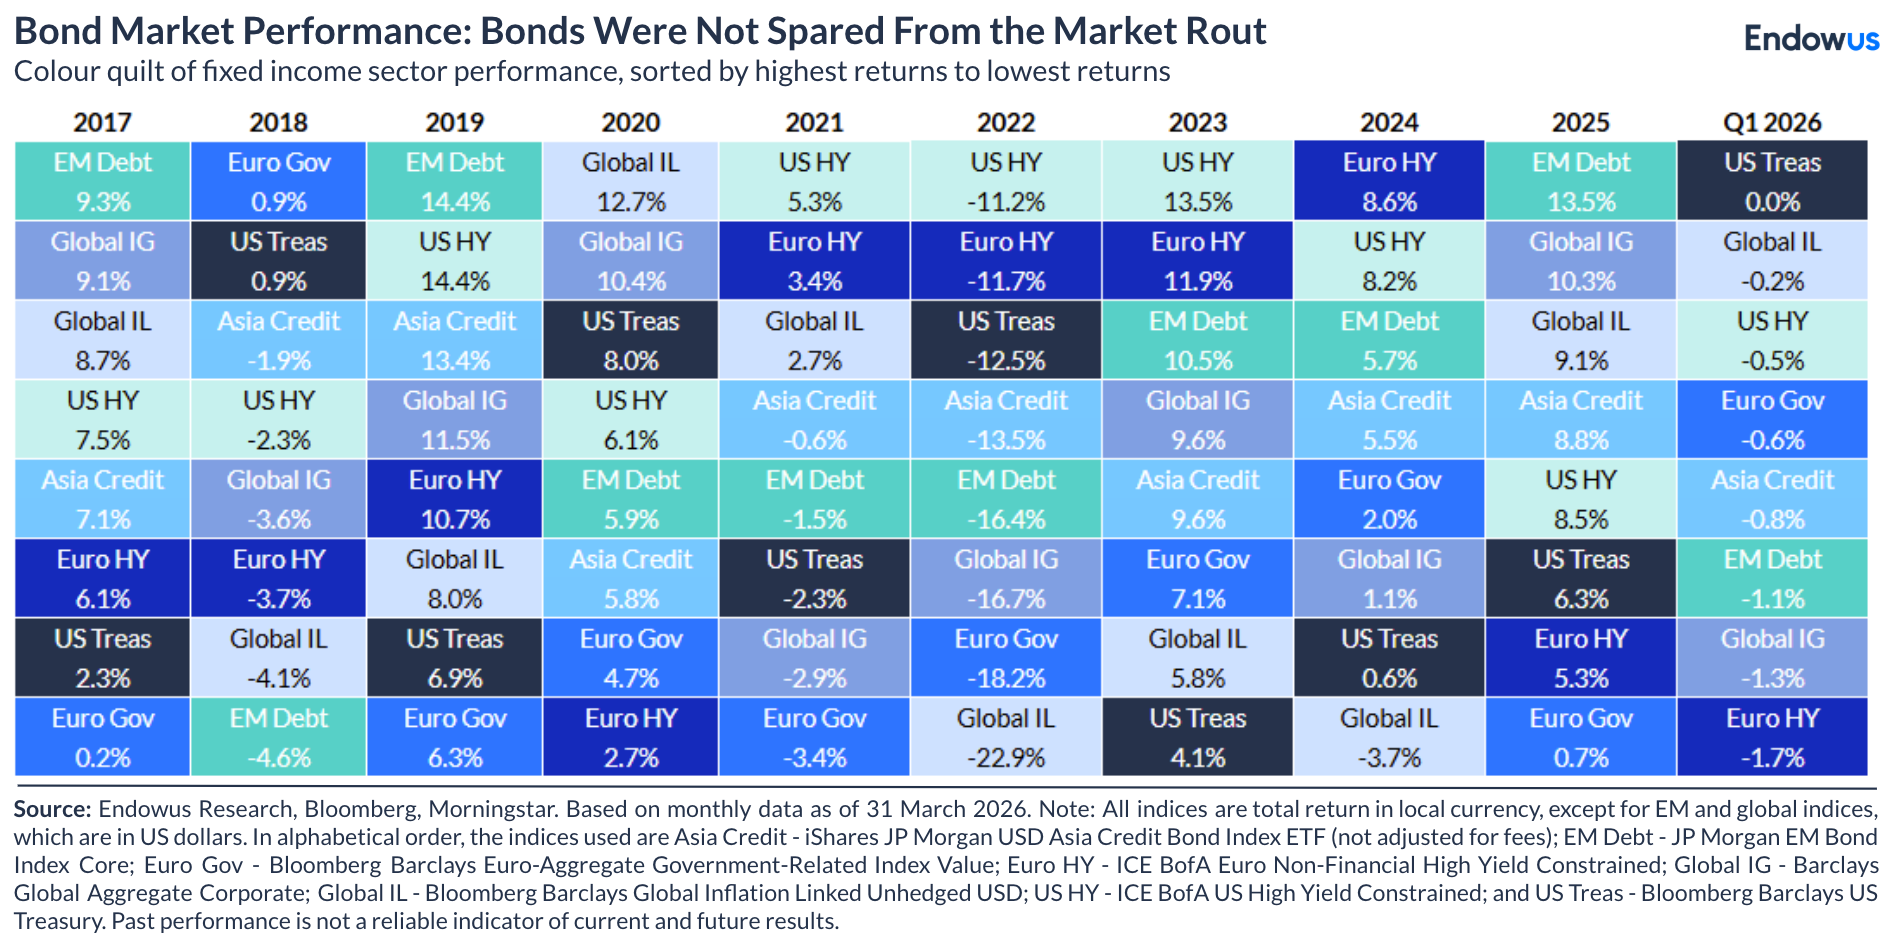
- Navigating bond volatility: Rising inflation fears triggered a sharp sell-off particularly with longer-duration credit,
- Explore the Endowus Flagship Portfolios: your one-stop solution for low-cost, globally diversified core allocation.
In the first quarter of 2026, markets were reshaped by a confluence of forces that few had anticipated at the turn of the year: an escalating geopolitical conflict in the Middle East, a dramatic energy price shock, renewed inflation concerns, and a consequent reassessment of central bank policy paths globally.
What began as a continuation of the broad rotation away from US mega-cap technology that started in late 2025 became increasingly dominated by the macroeconomic implications of the US-Iran conflict. The quarter ended with risk assets broadly in the red, but meaningful pockets of outperformance in energy, defensive equity, and select non-US markets that validated the importance of diversification.
Macro backdrop
The defining macro event of the quarter was the escalation of the conflict between the United States, Israel, and Iran.
On 28 February 2026, coordinated airstrikes targeted Iranian military and nuclear facilities. Iran retaliated with missile and drone attacks on regional US military bases and, most consequentially for markets, disrupted shipping through the Strait of Hormuz, a critical artery through which roughly 20% of global oil supply passes. Estimates suggest flows through the Strait declined by as much as 95% at the height of the disruption. The human and economic consequences of this conflict proved to be the single most significant driver of cross-asset performance in Q1 2026.
The Strait of Hormuz disruption pushed oil prices to near-record levels, with US crude rising more than 50% from the start of the conflict, approaching and testing the $110/bbl level by quarter-end. These elevated energy prices transmitted almost immediately into inflation data, with the OECD revising its inflation forecast for the G20 upward by 1.2 percentage points to 4.0%.
Global equities ended the quarter down 2.9% on a USD basis after being up 4.9% until February while global bonds also erased all of its YTD gains in March.
Gold had a volatile but overall constructive quarter. After extending its extraordinary 2025 rally—gaining roughly 25% in January to briefly trade above $5,300 per troy ounce—gold suffered a sharp correction at the end of January, and then again in March as the surging US dollar following the Iran conflict escalation triggered de-risking even from Gold. The US dollar index (DXY) also had a volatile quarter, weakening notably against major currencies through January and early February as rate cut expectations built, only to reverse sharply as the Iran conflict drove safe-haven demand. The DXY settled near 100 by quarter-end.
Coming into 2026, the Federal Reserve had cut rates three times in the second half of 2025 (bringing the upper end of the Fed funds rate to 3.75%), and markets were pricing in further easing. Indeed, through the first two months of 2026, softer economic data continued to make the case for additional cuts, and bond markets rallied in anticipation. The Iran war abruptly reversed this narrative. The energy-driven inflation shock made it untenable for the Fed to ease further, and by quarter-end bond traders were beginning to price in the possibility of a rate hike rather than further cuts.
Global equity markets
Q1 2026 was, for most equity markets, a difficult quarter, particularly in the second half of the period.
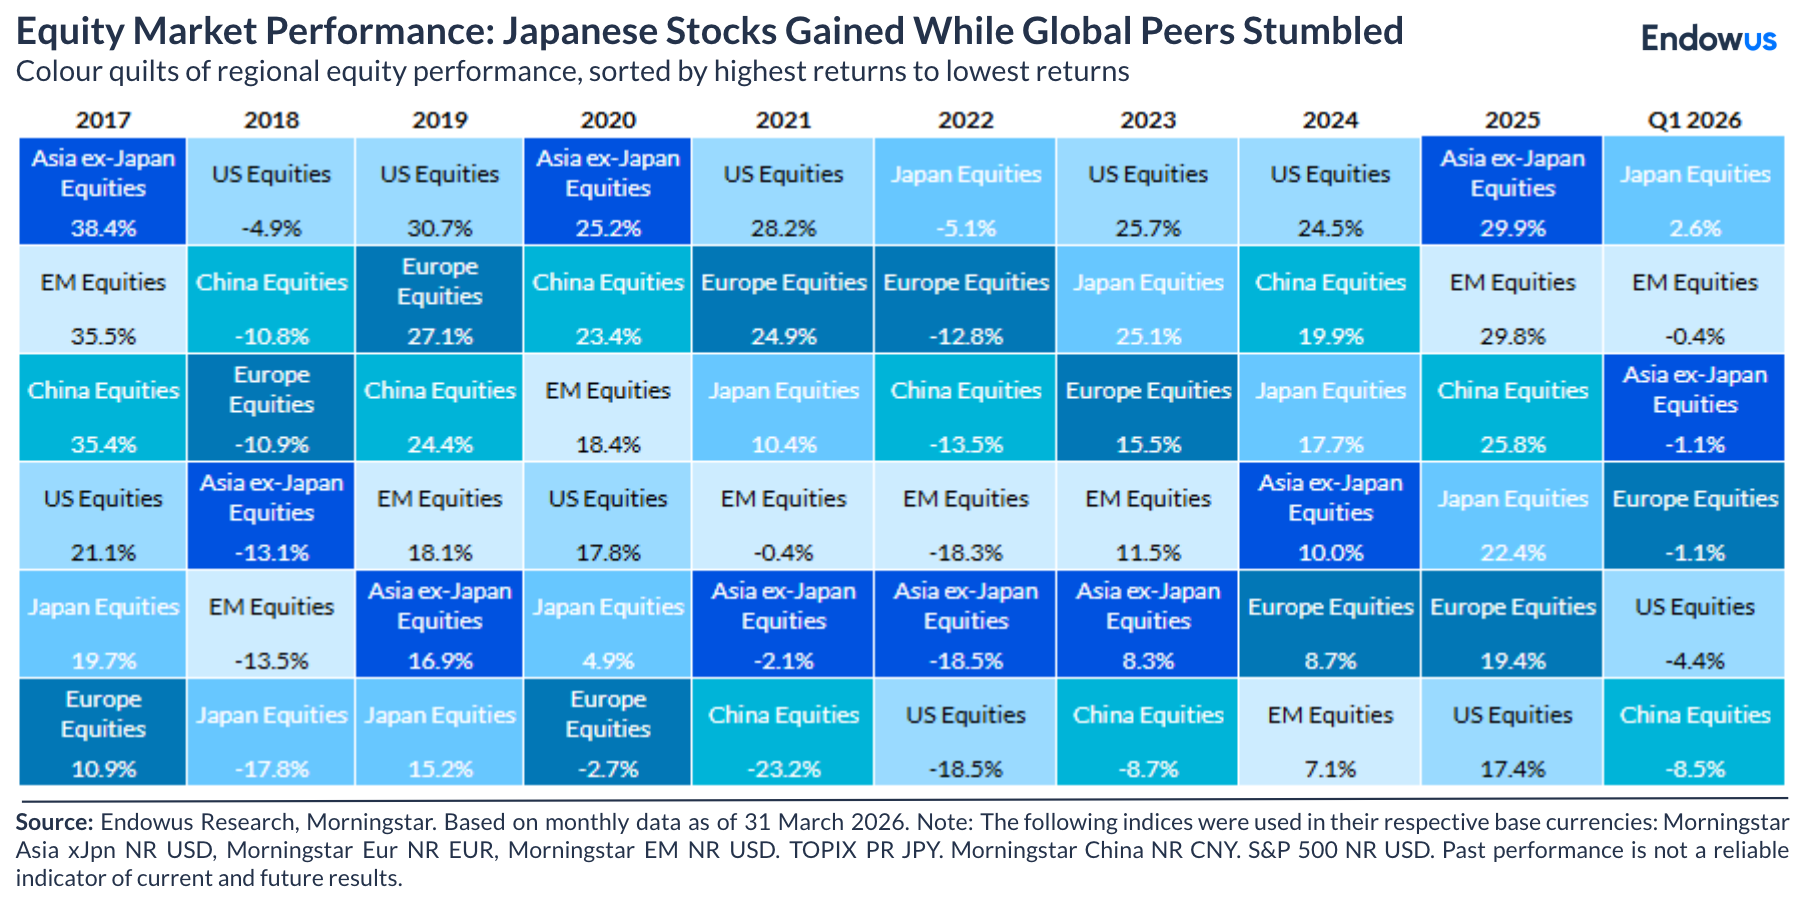
The S&P 500 fell approximately 4.4% over the quarter, rising 1.4% in January before declining 0.8% in February and a more pronounced 5.0% in March as the conflict escalated. The Nasdaq Composite fared worse, falling close to 6% as the rotation away from mega-cap technology accelerated. Developed markets ex-US outperformed US markets in 1Q continuing a trend that began in earnings in 2025. Emerging markets presented a mixed picture in 1Q following their exceptional performance in 2025.
The most significant development within US equities was the continued and decisive rotation away from the mega-cap technology names that had led markets since 2022. All seven members of the so-called "Magnificent 7" declined in Q1, collectively accounting for nearly 90% of the S&P 500's quarterly loss.
The flip side of this dynamic was meaningful outperformance in value, small- and mid-cap, and defensive sectors. Mid-cap stocks and small-caps actually posted positive returns for the quarter. Also Russell 1000 Value significantly outperformed Russell 1000 Growth. Energy was the standout sector by a wide margin, rising 32% as the oil price surge translated directly into earnings upgrades for producers and infrastructure companies. Utilities gained 8%, Materials rose 6%, and Consumer Staples added 3% as investors sought defensive income amid geopolitical uncertainty.
European equities showed relative resilience, supported by fiscal expansion in defence spending and infrastructure investment, improving household spending, and continued ECB easing earlier in the cycle. The prospect of a weaker US dollar, which materialised particularly in January and early February, provided an additional tailwind for non-US assets in USD terms, though the dollar subsequently strengthened as the conflict pushed safe-haven flows into Treasuries and the greenback.
Japan remained an important source of opportunity for global investors. Continued expectations for positive fiscal expansion under the government boosted equities, with inflows into Japanese stocks remaining elevated despite domestic political uncertainty around elections and ongoing BoJ policy debate. However, a notable rise in JGB yields in January rippled through global fixed income markets, a reminder of Japan's systemic importance in global rates.
Emerging markets entered the quarter with strong momentum and attractive valuations, with forward P/E ratios around 14x versus the S&P 500's 22x at the start of the year. However, the energy shock and dollar strength weighed on EM assets during the second half of the quarter, particularly EM debt. EM equities nonetheless showed relative resilience compared to their full-year 2025 trajectory.
Country divergence was significant. India, after a strong multi-year run, continued to see foreign investors take profits, with foreign ownership of Indian equities at 15-year lows; however, the structural growth story remains intact and dips may prove opportunistic for patient investors. China continued its transition to advanced manufacturing, with credit flowing into semiconductors, robotics, and biotech. Korean and Taiwanese markets—tightly linked to the global semiconductor supply chain and the AI hardware buildout—continued to benefit from hyperscaler AI capital expenditure. Latin American markets, benefiting from attractive valuations and commodity exposure, showed continued relative strength.
Global fixed income markets
The fixed income story of Q1 2026 was one of two distinct halves, dramatically interrupted by the onset of the Iran conflict. Through January and into mid-February, softer economic data and expectations of Fed cuts drove rallies in Treasuries, with the 10-year US Treasury yield falling to as low as 3.97%—its lowest level since September 2024. The Morningstar US Core Bond Index gained nearly 2% in the first two months of the year.
Then, almost instantaneously, the war changed everything. Rather than acting as a safe haven (as it typically does during geopolitical stress), the 10-year Treasury sold off sharply as investors priced in the inflation consequences of the oil shock, with the 10-year yield climbing to approximately 4.88% by end-March — its highest level since mid-2025.
Corporate bonds underperformed Treasuries for the quarter as credit spreads widened in response to the deteriorating growth and inflation outlook. Investment-grade corporates fell approximately 1.3% for the quarter, underperforming the near-flat Treasury index. High yield spreads, which had been trading at historically tight levels (near 2.7% versus the long-run average of 4.9%) entering the year, widened as investor risk appetite contracted and concerns about leveraged borrowers and energy-exposed issuers mounted.
Securitised credit, including agency MBS, CLOs, and ABS, outperformed corporate credit during the quarter. Strong fundamentals, stable demand, and a smaller starting yield gap to Treasuries helped insulate this sector from the worst of the credit spread widening. Floating-rate structures like CLOs proved particularly resilient as the prospect of rates staying higher for longer actually supported coupon income.
After being a consistent outperformer throughout 2025, EM debt was the weakest sub-asset class in fixed income during Q1 2026. The twin headwinds of a stronger US dollar and rising global risk aversion—both driven by the Iran conflict—weighed heavily.
Short-duration Treasury Inflation-Protected Securities (TIPS) were among the better performers in fixed income, gaining around 0.84–0.97% for the quarter. Rising near-term inflation expectations driven by energy prices, combined with the low duration profile of short-term TIPS, provided a constructive backdrop for inflation-linked bonds. This was in sharp contrast to longer-duration fixed income, where the rate rise dominated returns.
Invest with Clarity through Endowus Hong Kong
With Endowus, you can plan and manage your money by investing in institutional-grade portfolios, curated by our Investment Office, that offer globally diversified exposure using Best-in-Class underlying funds as building blocks. You can start with our pre-populated Flagship and Satellite portfolios and either take the template as is or tweak the portfolio allocations to suit your personal risk appetite, preference, and goals.
A core portfolio should always anchor an investor's strategic allocation. It is ideally built for long-term, stable market returns, and usually tracks a passive index. This means that its geographical and sectoral allocations mirror those of the index as closely as possible. Satellite positions tend to be more tactical, and concentrated in specific segments of the markets. They may allow investors to capitalise on specific opportunities as they arise.
Alternatively, on the Fund Smart platform, you can build your own do-it-yourself (DIY) portfolios from scratch, through Endowus’ proprietary portfolio creation tool.
If you are new to Endowus in Hong Kong, you can get started by opening an account with us.
Note: Figures in this article are based on Morningstar and Bloomberg data.
<divider><divider>
Risk Warnings
Investment involves risk. Past performance is not an indicator nor a guarantee of future performance. The value of investments and the income from them can go down as well as up, and you may not get the full amount you invested. Rates of exchange may cause the value of investments to go up or down.
This article is not intended to be relied upon as a forecast or research or investment advice, and should not form the basis of any investment or other decisions. The information contained herein is not intended, and should not be construed, as any legal, tax, regulatory, accounting or financial advice. If you would like investment, accounting, tax or legal advice, you should consult with your own professional advisors regarding your individual circumstances and needs.
The information in this article may not be suitable for all investors. You are responsible for any action that you take or decision that you make in reliance on any content in this article, and you agree that Endowus HK Limited (“Endowus”) is not liable under any circumstances.
No invitation or solicitation
Neither the information, nor any opinion, contained in this article constitutes a recommendation, offer or solicitation by Endowus or its affiliates to you to buy or sell any securities, collective investment schemes or other financial instruments or services, nor shall any such security, collective investment scheme, or other financial instruments or services be offered or sold to any person in any jurisdiction in which such offer, solicitation, purchase, or sale would be unlawful under the securities laws of such jurisdiction.
This is not intended to be an invitation or offer made to the public to subscribe for any financial product or to enter into any transaction.
Accuracy of Information
Whilst Endowus has made reasonable efforts to provide accurate and timely information, there may be inadvertent delays, omissions, technical or factual inaccuracies or errors in any such information. Endowus does not warrant or represent that the information in this article is correct, accurate or reliable.
Opinions
Any opinion or estimate above is made on a general basis and none of Endowus, nor any of its affiliates, representatives or agents have given any consideration to nor have made any investigation of the objective, financial situation or particular need of any user, reader, any specific person or group of persons. Opinions expressed herein are subject to change without notice.
Any forward-looking statements, prediction, projection or forecast on the economy, stock market, bond market or economic trends of the markets contained in this article are subject to market influences and contingent upon matters outside the control of Endowus and therefore may not be realised in the future.
In presenting the information above, none of Endowus, its affiliates, directors, employees, representatives or agents have given any consideration to, nor have made any investigation of the objective, financial situation or particular need of any user, reader, any specific person or group of persons. Therefore, no representation is made as to the completeness and adequacy of the information to make an informed decision. You should carefully consider whether any investment views and products/ services are appropriate in view of your investment experience, objectives, financial resources and relevant circumstances.
This article has not been reviewed by the Securities and Futures Commission of Hong Kong.
.png)

.png)