.webp)
.webp)
.webp)
.webp)






The second quarter of 2026 brought a dramatic reversal of Q1’s elevated oil prices and equity drawdowns. It was one of the strongest quarterly performances in recent history, driven by the gradual—if temporary—easing of Middle East tensions and a powerful re-emergence of the AI trade.
Beneath headline returns, however, uncertainty lingers. US Inflation remains above target (although the June CPI print was soft from lower oil prices), the Fed signalled that the next move in rates is more likely up than down, and the situation surrounding the Strait of Hormuz remains unresolved.
Overall, the quarter ended with global equities up 14.7% (in USD terms), the Nasdaq posting its best performance since 2020 and emerging markets delivering their strongest return since 2009.
Macro backdrop
The dominant macro narrative of Q2 was the de-escalation of the US-Iran conflict. On 17 Jun, US President Donald Trump and Iranian President Masoud Pezeshkian signed a memorandum of understanding (MOU) to end hostilities and reopen the Strait of Hormuz to all shipping traffic. Amid the resolution, Brent oil prices went from a high of USD126 in late April to a low of USD72 at the end of the quarter.
Risk assets—and increasingly, oil—aggressively priced a substantial improvement and a return to normal traffic in the Strait as the quarter approached its end, which led to substantial equity outperformance.
Inflation remained a defining concern. US Core PCE reached 3.4% year-on-year in May— its highest reading since 2023-with headline PCE above 4%. It was against this backdrop that Kevin Warsh, the newly installed Federal Reserve Chair, presided over his first FOMC meeting. Rates were on put hold, as broadly expected, but the accompanying communication was hawkish, with the Fed removing all language indicating a bias toward future cuts, and the dot plot introducing the possibility of a rate hike before year-end.
Global equity
Q2 was an extremely positive quarter for global equities with the Morningstar Global Markets Index rising 14.7%, lifting first-half 2026 returns to 11.4% and recovering the ground lost in the first quarter. The advance was broad-based but uneven, with the strongest gains concentrated in technology hardware and semiconductor names linked to the AI infrastructure buildout.
US equity markets rose 15.1% for the quarter, recovering all of its Q1 losses and setting a new all-time high in June. The Nasdaq 100 Index surged 27.5%, posting one of its best quarters in 25 years. The catalyst was a decisive resumption of the AI investment theme.
Rather than software and platform names, the rally was led by semiconductor and memory chip manufacturers—the "picks and shovels" of the AI infrastructure buildout. The Philadelphia Semiconductor Index (SOX) rose 87.8% for the quarter, its best performance since inception, as investors re-priced how capital-intensive large-scale AI deployment is likely to be.
At the sector level, all major sectors outside of energy finished the quarter in positive territory. Technology and communication services led in the first two months, before June saw a rotation into more cyclical and defensive areas such as industrials, financials, and healthcare, as profit-taking reduced momentum in the highest-flying names. Energy gave back a meaningful share of its first-quarter gains as oil prices retreated, though it remained among the stronger sectors over the first half as a whole.

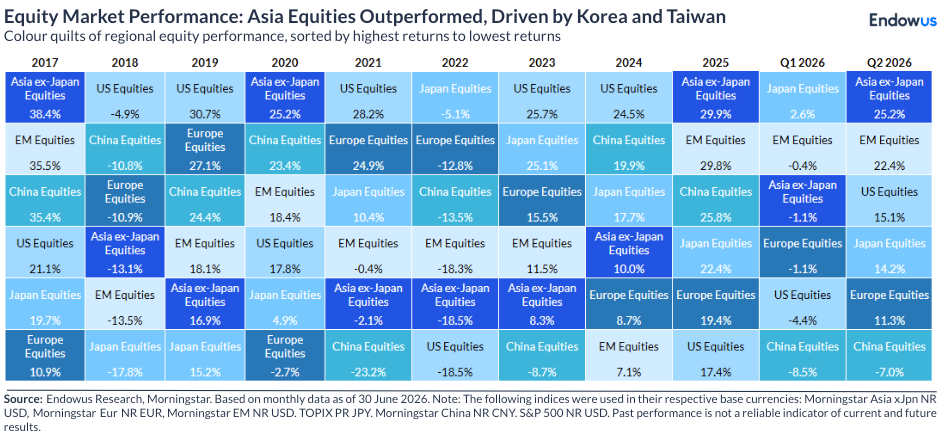
Emerging markets (EM) were the standout performers of the quarter, rising 22.4%—their best quarterly return since Q2 2009. The rally was almost entirely explained by the AI hardware supply chain: Korean and Taiwanese markets, home to the world's dominant memory and semiconductor manufacturers, delivered extraordinary returns. SK Hynix and Samsung Electronics tripled and doubled respectively, propelling Korean equities to their best quarterly performance since 1998. Taiwan benefited similarly. Away from North Asia, breadth was thinner: Latin America and parts of ASEAN posted more modest gains, as softer commodity prices and a stronger US dollar worked against them.
Developed market equities outside the US also showed a strong recovery in Q2 albeit more modest compared to EM. European equities recovered from Q1's energy-driven underperformance but lagged other regions, as the continent had been disproportionately affected by the Middle East energy shock given its reliance on the region for oil imports. As energy fears eased, European stocks rebounded, though multiple expansion rather than earnings growth drove much of the return. Japan stood out within the DM group, with Tokyo's TOPIX index gaining 14% over the quarter. A weaker yen and a steepening domestic yield curve provided tailwinds for exporters and the financial sector, and investor flows into Japan remained constructive.
Global fixed income
Fixed income spent the second quarter caught between two opposing forces: a retreating oil price on one side and a Federal Reserve (Fed) that had signalled a more hawkish stance on the other. The two largely offset each other, and most fixed income sub-classes delivered muted but positive returns.
The 10-year US Treasury yield swung between 4.3% and 4.6% during the quarter, settling at approximately 4.47% by 30 June. The front end was less settled: the 2-year yield rose 38 basis points as markets absorbed the Fed's pivot, flattening the gap between 2- and 10-year yields to just 29 basis points. The Bloomberg US Aggregate Bond Index returned 0.6% for the quarter, a modest recovery after the first-quarter losses.
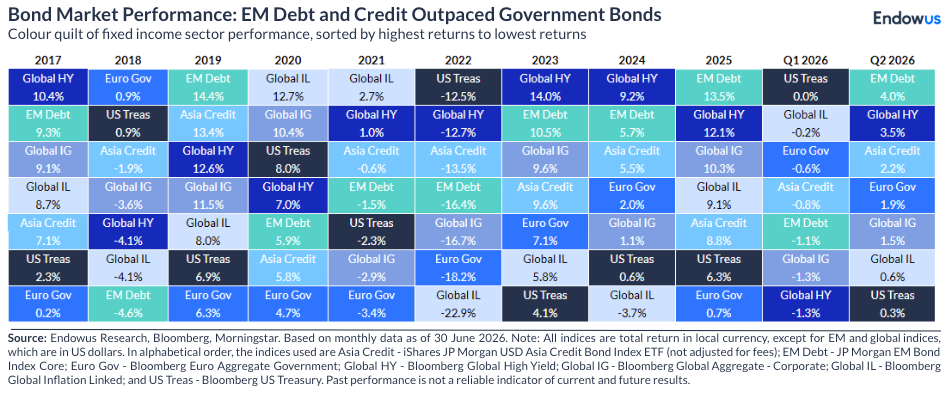
Global investment-grade bonds gained 1.5% as spreads tightened, even against heavy new issuance — much of it from AI hyperscalers, the large cloud providers raising capital to fund data-centre expansion. Solid corporate fundamentals and an improving macro backdrop allowed spreads to compress despite that supply. Global high-yield bonds added approximately 3.5%, as a growing appetite for risk outweighed concerns about more leveraged borrowers.
Emerging market debt was firm overall, though a stronger US dollar created headwinds for hard-currency borrowers.
Commodities
Gold gave back ground in the second quarter after an extended multi-year advance. After briefly testing $5,420/oz in early March, it sold off through Q2, falling to as low as $4,510/oz in late April as the US dollar strengthened and real yields remained elevated. The hawkish pivot from the new Fed chair, combined with the DXY breaking above key technical resistance, proved a sustained headwind for precious metals. Gold ended the quarter down 14% which makes its year-to-date performance -7%
Oil, having been the defining market theme of Q1, reversed sharply in Q2. Brent oil fell from its $126/bbl peak in late April to approximately $73/bbl by quarter-end, as the US-Iran MOU and the progressive reopening of the Strait of Hormuz removed the supply shock premium.
The US dollar ended Q2 on a stronger footing, particularly following the June Fed meeting, with the DXY breaking above the 100.5 level that had capped it for much of the prior 12 months.
Note: Figures in this article are based on Morningstar and Bloomberg data.
Risk Warnings
Investment involves risk. Past performance is not an indicator nor a guarantee of future performance. The value of investments and the income from them can go down as well as up, and you may not get the full amount you invested. Rates of exchange may cause the value of investments to go up or down.
This article is not intended to be relied upon as a forecast or research or investment advice, and should not form the basis of any investment or other decisions. The information contained herein is not intended, and should not be construed, as any legal, tax, regulatory, accounting or financial advice. If you would like investment, accounting, tax or legal advice, you should consult with your own professional advisors regarding your individual circumstances and needs.
The information in this article may not be suitable for all investors. You are responsible for any action that you take or decision that you make in reliance on any content in this article, and you agree that Endowus HK Limited (“Endowus”) is not liable under any circumstances.
No invitation or solicitation
Neither the information, nor any opinion, contained in this article constitutes a recommendation, offer or solicitation by Endowus or its affiliates to you to buy or sell any securities, collective investment schemes or other financial instruments or services, nor shall any such security, collective investment scheme, or other financial instruments or services be offered or sold to any person in any jurisdiction in which such offer, solicitation, purchase, or sale would be unlawful under the securities laws of such jurisdiction.
This is not intended to be an invitation or offer made to the public to subscribe for any financial product or to enter into any transaction.
Accuracy of Information
Whilst Endowus has made reasonable efforts to provide accurate and timely information, there may be inadvertent delays, omissions, technical or factual inaccuracies or errors in any such information. Endowus does not warrant or represent that the information in this article is correct, accurate or reliable.
Opinions
Any opinion or estimate above is made on a general basis and none of Endowus, nor any of its affiliates, representatives or agents have given any consideration to nor have made any investigation of the objective, financial situation or particular need of any user, reader, any specific person or group of persons. Opinions expressed herein are subject to change without notice.
Any forward-looking statements, prediction, projection or forecast on the economy, stock market, bond market or economic trends of the markets contained in this article are subject to market influences and contingent upon matters outside the control of Endowus and therefore may not be realised in the future.
In presenting the information above, none of Endowus, its affiliates, directors, employees, representatives or agents have given any consideration to, nor have made any investigation of the objective, financial situation or particular need of any user, reader, any specific person or group of persons. Therefore, no representation is made as to the completeness and adequacy of the information to make an informed decision. You should carefully consider whether any investment views and products/ services are appropriate in view of your investment experience, objectives, financial resources and relevant circumstances.
This article has not been reviewed by the Securities and Futures Commission of Hong Kong.
.png)

.png)