.webp)
.webp)
.webp)
.webp)






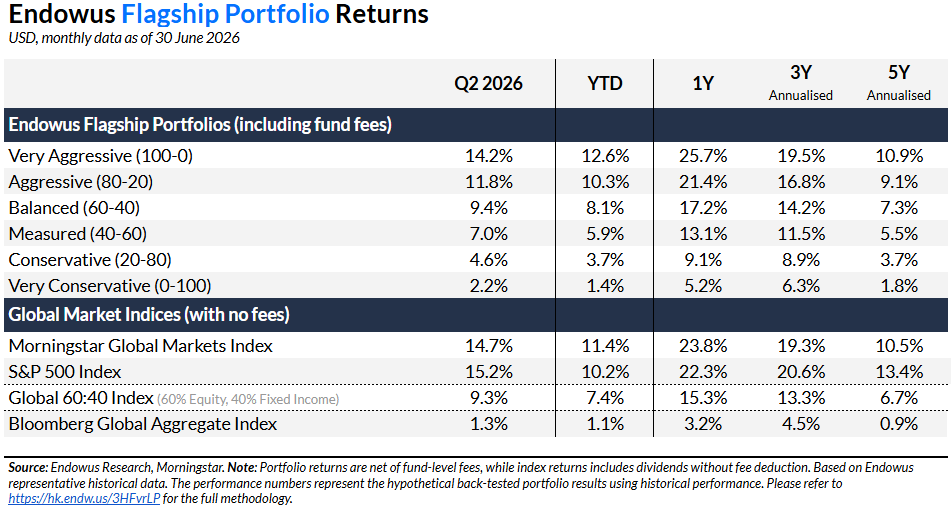
- The Endowus Flagship 100% Equity Portfolio gained 14.2% in Q2 2026, but underperformed the global equity market which delivered 14.7%. On the other hand, the 100% Fixed Income Portfolio gained 2.2% over the same period and outperformed the broader fixed income market which gained 1.3%.
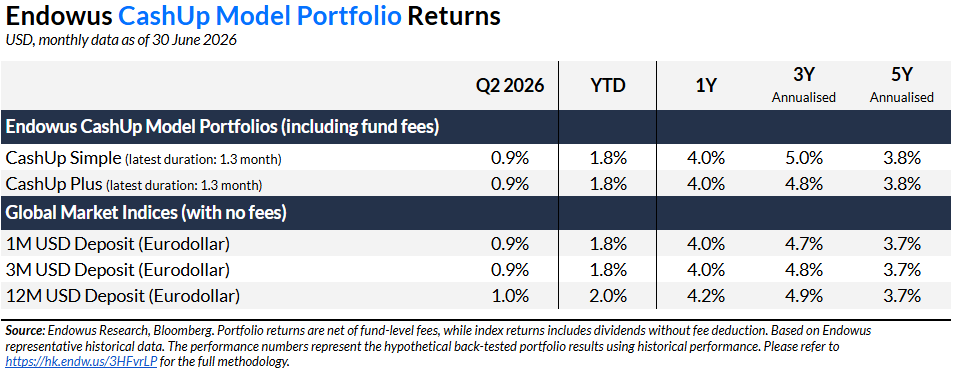
- The CashUp Portfolios continued to deliver positive returns in Q2 2026, ending the quarter up 0.9% for both CashUp Simple and CashUp Plus.
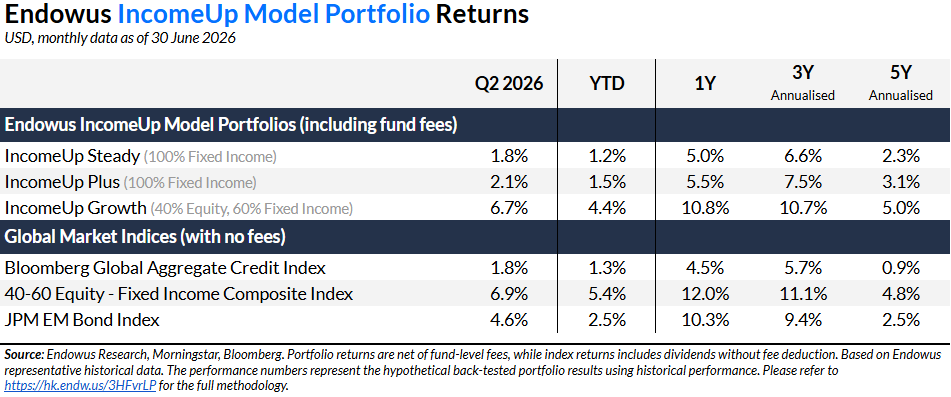
- IncomeUp Portfolios delivered positive performance in Q2 2026, but relative performance differed across the portfolios. IncomeUp Steady rose 1.8% and performed in line with the broader credit market, while IncomeUp Plus gained 2.1% and outperformed the broader credit market. IncomeUp Growth delivered 6.7%, but underperformed its 40-60 benchmark which gained 6.9%.
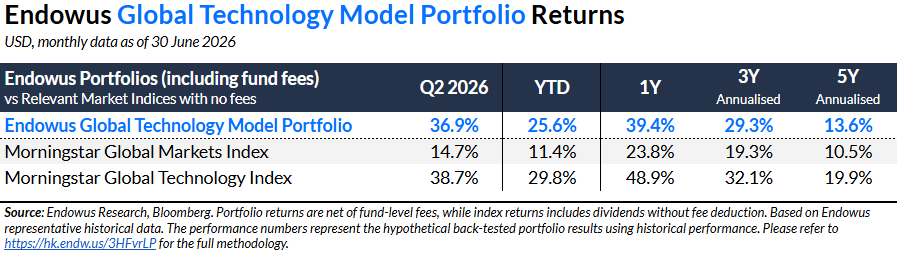
- The Global Technology model portfolio gained 36.9% over the quarter, slightly trailing the broader technology market index which gained 38.7%.
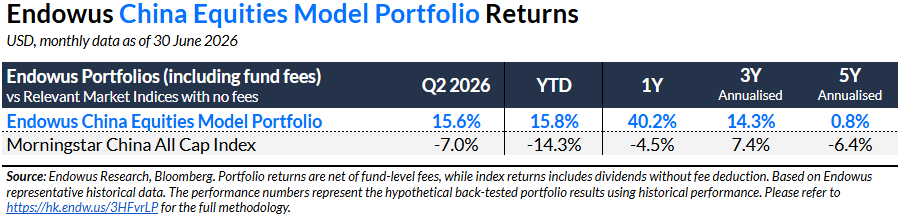
- The China Equity model portfolio gained 15.6% during the quarter, significantly outperforming the Morningstar China All Cap Index, which fell 7.0%.
About the Endowus Flagship Portfolios: The Endowus Flagship Portfolios are a one-stop solution to globally diversified portfolios, tailored for varying risk profiles and suitable for your core, long-term wealth accumulation.
Endowus Flagship Portfolios
Key performance highlights:
The Flagship 100% Equity Portfolio advanced by 14.2% in Q2 2026, but underperformed the broader global equity market, which gained 14.7%. The Portfolio’s underperformance was a result of its overweight to value stocks, which underperformed their growth counterparts during the quarter. Further underperformance was mitigated by the Portfolio’s overweight to emerging market equities, which saw robust performance led by technology focused markets such as Korea and Taiwan.
Within the Portfolio, the Amundi Core MSCI Emerging Markets Fund was the best performer, ending the quarter with a 24.1% gain. The Fund passively tracks the emerging market equity index, which experienced robust gains during the quarter. On the other hand, the Dimensional Pacific Basin Small Companies Fund was the weakest performer, ending the quarter with an 8.0% gain. The Fund lagged its global peers due to its overweight to Japan small cap stocks, as well as Australia stocks.
The Flagship 100% Fixed Income Portfolio gained 2.2% in the second quarter, outperforming the broader fixed income market which gained 1.3%. The Portfolio’s outperformance was driven by its overweight to emerging market bonds, which benefited from spread compression and healthy yields that attracted inflows.
Driven by its emphasis on emerging market bonds, the PIMCO GIS Emerging Markets Bond Fund ended the quarter with a 4.8% gain and was the Portfolio’s top performer. In contrast, the weakest performer was the iShares Global Aggregate 1-5 Year Bond Index Fund, which gained 1.0%. The Fund lagged its global peers due to its lower exposure to credit.
Read more: Introducing Flagship Portfolios
Endowus CashUp model portfolios
Read more: How does Endowus calculate representative historical performance?
About the Endowus CashUp Portfolios: Designed for short-term cash management, the CashUp portfolios are built using high-quality money market funds and ultra-short duration fixed-income funds.
Key performance highlights:
The second quarter of 2026 saw a continued sell-off in U.S. rates through June, as the market priced in concerns that inflation might stay elevated. The 2-year US Treasury yield jumped 38bps over the quarter to 4.17%, while the 10-year yield climbed 14bps to 4.46%, as markets re-assessed policy expectations and started to price in 1-2 rate hikes by year end. The Fed kept the federal funds rate firmly on hold at 3.5% - 3.75% at its June meeting, pointing to elevated inflation and energy shocks. Despite rising U.S. rates, both IG and HY credit spreads tightened as the markets showed signs of recovery in Q2 supported by progress in US/Iran negotiations and a memorandum of understanding signed in mid June. CashUp portfolios, with a high-quality emphasis and an ultra-short duration profile, remained resilient and delivered positive returns.
CashUp Simple finished the quarter up 0.9%. The two underlying funds in the portfolio, Ping An USD Money Market Fund and HSBC Global Money US Dollar, both generated positive, stable returns each month during the quarter, with Ping An USD MMF outperforming slightly. Their very short-dated instruments - short-term deposits and high-quality money market securities - proved resilient to rising rates, while capturing steady yield for the portfolio. CashUp Simple remains suitable for investors with more immediate cash needs.
CashUp Plus generated a positive performance in the second quarter, adding 0.9%. Both Ping An USD Money Market Fund and Amundi Cash USD Fund generated steady, positive returns for the portfolio. Their ultra-low duration made them resilient to rising rates, with a slight yield advantage over CashUp Simple due to its higher allocation to duration and credit. Relative to CashUp Simple, CashUp Plus remains more suited towards investors with near to mid-term cash needs.
Our CashUp portfolios aim to generate returns comparable to prevailing money market rates while minimising downside capital risks and maintaining a high level of liquidity. Investors are reminded that the CashUp portfolios are not capital protected and may rise or fall in value.
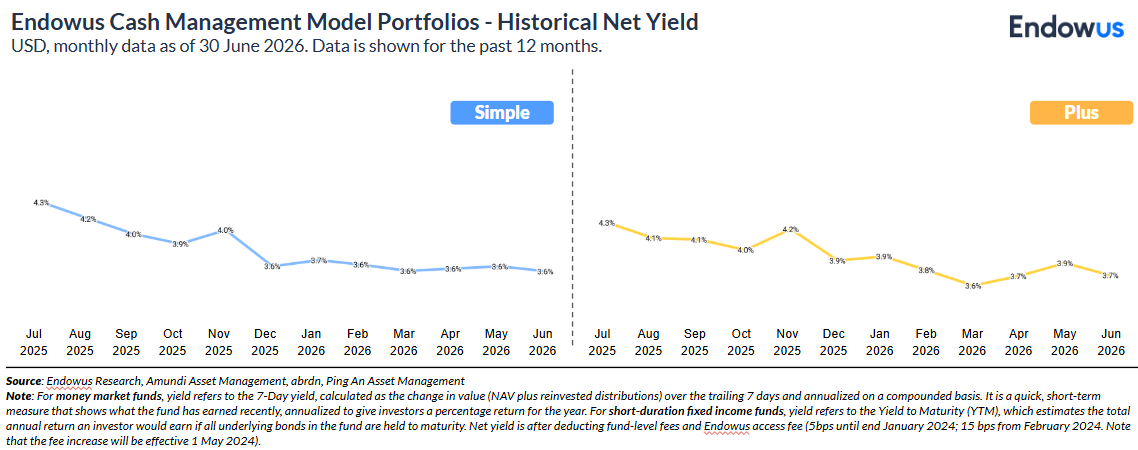
CashUp Portfolios, primarily exposed to USD market front-end rates, continue to see relatively rangebound yields over the quarter with the Fed’s policy rate on hold. Investors can review their investment goals and assess whether their current CashUp Portfolio remains aligned with their needs.
Read more: Introducing the newly launched CashUp Portfolios
Endowus IncomeUp model portfolios
Read more: How does Endowus calculate representative historical performance?
About the Endowus IncomeUp model portfolios: The three IncomeUp model portfolios meet different income and capital preservation or growth needs for investors at different life stages.
Key performance highlights:
The IncomeUp Steady Portfolio gained 1.8% in Q2 2026, in line with the broader credit market. Overall, in the second quarter, risk sentiment turned positive and provided tailwinds for credit exposure. However, treasury yields edged up with curve flattening in the quarter, a negative for duration exposure. All of the underlying funds delivered positive returns, and the leader of the pact was Neuberger Berman Short Duration Emerging Markets Debt Fund (+2.5%), while the Asian bonds exposure via Fidelity Asian Bond Fund was a laggard.
The IncomeUp Plus Portfolio outperformed the border credit market and returned 2.1% in the second quarter. Similarly, improved risk sentiment was a tailwind for the portfolio’s credit exposure. Additionally, its 30% allocation to high yield bonds lifted performance further.
The IncomeUp Growth Portfolio returned 6.7% in Q2 2026, slightly underperforming the 40-60 benchmark. Its fixed income sleeve mirrors the IncomeUp Steady Portfolio, while the equity sleeve posted strong double-digit returns, albeit slightly lagging the global equities market. The second-quarter equity rally was propelled by renewed AI optimism, causing Growth and small-cap stocks to outperform Value. Against this backdrop, the AB Low Volatility Equity Portfolio faced headwinds.
Read more: Introducing Endowus IncomeUp Portfolios
Endowus Satellite model portfolios
The Satellite model portfolios are designed to supplement the Core portfolios and offer Hong Kong investors specific exposure to opportunities in selected regions, themes, asset classes, and trends. In taking a core-satellite approach, most investors should allocate the bulk of their asset allocation to the Core portfolios.
Global Technology model portfolio
Read more: How does Endowus calculate representative historical performance?
About the Global Technology model portfolio: It aims to provide access to the most innovative technology and technology-related companies around the world, across various market capitalisations and sectors.
The Technology Portfolio rose 36.9% in Q2 2026. This compares to the Morningstar Global Markets Index which rose 14.7% and the Morningstar Global Technology Index which rose 38.7% during the same period.
While 5 of the 6 underlying tech funds outperformed the Global Tech Index, the Fidelity Global Technology Fund (+18%) which has the largest weight (30%) in the portfolio had a noticeable underperformance in Q2 which impacted the relative performance of the overall portfolio. The Fidelity Tech fund has historically shown strong risk adjusted performance given its relatively low volatility and strong valuation discipline. However, in 2Q the relative performance was primarily impacted by the absence of exposure to high flying semiconductor names such as Micron Technology and SK Hynix. The manager remains cautious on the sustainability of the current AI-driven capital expenditure cycle.
The BGF Next Generation Technology Fund (+60%) and the BGF World Technology Fund (+56%) were the best performers thanks to the underweight to software, stock selection, and performance of the semiconductor sector. The Franklin Technology Fund (+43%), Janus Henderson Horizon Global Tech Fund (+42%), and JPM US Technology Fund (+41%) also benefited from the strength of the semiconductor sector and outperformed the sector index. We believe the different views and styles of the managers provides good diversification for the portfolio.
Read more: Introducing the Global Technology model portfolio: ride the wave of tech innovation
China Equities model portfolio
Read more: How does Endowus calculate representative historical performance?
About the China Equity model portfolio: The China equity model portfolio aims to provide investors with holistic exposure to the China stock market and consists of five Best-In-Class China equity funds.
Key performance highlights: The China Equity model portfolio posted a 15.6% gain in Q2 2026, extending its substantial outperformance against the Morningstar China All Cap Index across Q1, Q2, and the year-to-date. This sustained lead was primarily driven by our structural tilt toward onshore A-shares and a strategic underweight to the benchmark-heavy offshore mega-caps. The T. Rowe Price China Evolution Fund remained the portfolio’s top-performing constituent, delivering a standout 31.6% return.
The global macroeconomic environment was defined by acute geopolitical volatility. Escalating US-China trade tensions and the early-March closure of the Strait of Hormuz triggered a severe global energy shock. This sparked a "risk-off" flight to safety, draining capital from emerging markets and reigniting global inflation fears.
Domestically, China’s economic recovery remained sluggish and unbalanced:
- Growth slowed: Q2 GDP growth decelerated to 4.3% year-over-year, missing market forecasts and falling short of Q1’s 5.0% expansion.
- Property and consumer drag: The protracted property sector downturn continues to erode household wealth and dampen consumer confidence. This was starkly evident in May retail sales, which contracted year-over-year for the first time since the pandemic.
- Export resilience: Conversely, manufacturing and exports acted as the primary growth engines. June exports surged 27%, driven by global demand for AI-related technology components and frontloading by US retailers anticipating tariff hikes. However, this heavy reliance on external demand leaves the broader economy vulnerable to ongoing trade frictions.
This turbulent backdrop created a sharp divergence across both geography and market capitalization, perfectly aligning with the portfolio’s strategic positioning.
- Onshore vs. Offshore: The March risk-off shock hit offshore-listed equities (H-shares and ADRs) the hardest, as they are highly sensitive to foreign portfolio flows and swing violently with global risk sentiment. Onshore A-shares proved much more resilient, remaining insulated from foreign capital flight and directly supported by domestic reflationary policies.
- Mid-Cap vs. Mega-Cap: This divergence extended down the market-cap spectrum. The widely held, offshore platform and technology giants that dominate the Morningstar index took the hardest hit of global risk aversion. In contrast, the portfolio’s underlying funds—such as the T. Rowe Price China Evolution Equity Fund—target "rising stars" beyond the top 100 mega-caps. This strategic focus on dynamic, domestically oriented mid- and small-cap companies provided a significant performance advantage over the quarter.
Sustainability - Equities model portfolio
Read more: How does Endowus calculate representative historical performance?
About the Sustainability - Equities model portfolio: It offers access to ESG (environmental, social, and governance), sustainable, and climate equity funds so that investors can contribute to a better, sustainable future.
Key performance highlights:
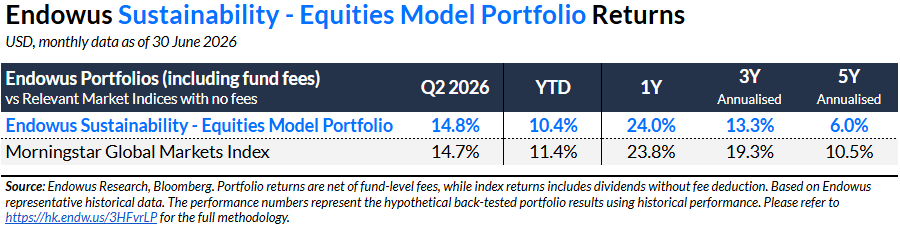
The Sustainability - Equities model portfolio slightly outperformed the broader Equity Index in Q2, delivering a strong return of 14.8%. Performance was led by the Abrdn SICAV I - Emerging Markets SDG Equity Fund, which benefited from a robust rally in emerging markets. Conversely, while the Schroder ISF Global Climate Change Fund also posted double-digit returns, it lagged the broader global equities market, which weighed on overall portfolio performance.
Future Trends model portfolio
Read more: How does Endowus calculate representative historical performance?
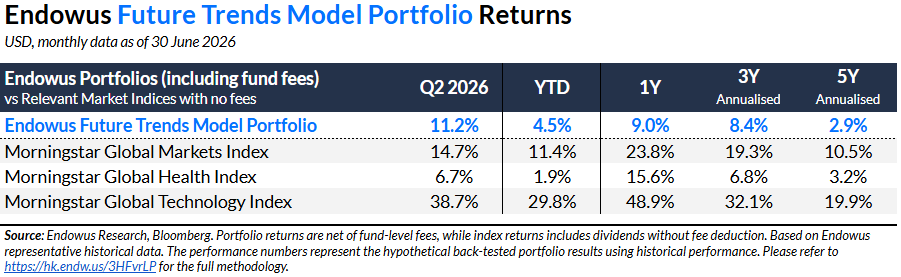
About the Future Trends model portfolio: It is a 100% equities portfolio made up of six Best-In-Class funds spanning the major themes of healthcare, technology, industrials, and more. It caters to investors seeking exposure to high-growth firms.
Key performance highlights: In Q2, the Future Trends model portfolio underperformed the broader Morningstar Global Markets Index, gaining 11.2% compared to the Index’s 14.7% return. The months of April and May were characterised by a strong rebound from the drawdown in March, and accounted for the bulk of the quarter’s returns.
Most of the underlying funds performed largely in line with the Index, with performance dragged down by Thematics Meta and AB International Healthcare. The Thematics Meta Fund generated a positive return of 9%, with mixed performance from its underlying thematic sleeves. The subscription economy and water themes were a drag on performance, offsetting a strong quarter from the AI & robotics and safety themes.
The AB International Healthcare Fund also generated a positive performance, but this was substantially lower than the broader equity market. The healthcare sector did not participate in April’s relief rally, but did emerge as the strongest performer in June due to positive regulatory developments, a surge in dealmaking, and strong capital inflows.
How to access portfolios on Endowus Hong Kong
With Endowus, you can plan and manage your money with institutional-grade portfolios that have been curated by our Investment Office, offering globally diversified exposure with Best-in-Class underlying funds as building blocks.
You can use these pre-populated portfolio templates as a starting point for your portfolio. You can either take the template as it is or tweak the portfolio allocations to suit your personal risk appetite, preference, and goals.
Alternatively, on the Fund Smart platform, you can build your own do-it-yourself (DIY) portfolios from scratch, through Endowus’ proprietary portfolio creation tool. To learn more about Fund Smart, refer to this article.
If you are new to Endowus in Hong Kong, you can get started by opening an account with us.
Already have an account with Endowus HK? Here are a few simple steps to start using Fund Smart:
- Log in to your Endowus account
- Click Invest > Redeem
- Click on Add Goal, and then follow the instructions to select the fund or portfolio of your choice, based on your investment horizon and objective.
Read more:
- Endowus Q3 2025 Market Update and Outlook — Stocks Soar, Gold Glitters
- Is 60/40 portfolio the future?
- Introducing the Endowus HK team
- Choosing Endowus when investing in Hong Kong
Risk Warnings
Investment involves risk. Past performance is not an indicator nor a guarantee of future performance or returns. Projected performance or returns is not guaranteed to materialise. The value of investments and the income from them can go down as well as up, and you may not get the full amount you invested. Rates of exchange may cause the value of investments to go up or down. Individual stock performance does not represent the return of a fund.
Risk related to discretionary management . As Flagship Portfolios are provided under discretionary services, Endowus will manage the assets under the portfolio subject to compliance with the terms and conditions of the DPM Services Agreement and on a fully discretionary basis; you will not have any role or right to make investment decisions, except for making contributions or withdrawals from the portfolio; it would not be mandatory for Endowus to provide the underlying fund prospectuses or other fund information to you for each and every investment decision made on behalf of you. You should exercise caution before investing in discretionary managed portfolios.
Flagship Portfolio may contain professional-investors only fund(s) and/or “Complex Product”. In general, Professional-investors only funds are funds that have not been authorised, nor have the offering documents been reviewed by the SFC. “Complex Products” (as defined by the Securities and Futures Commission, the “SFC”) refer to investment products (e.g. funds) whose terms, features and risks are not reasonably likely to be understood by retail investors because of their complex structures. Professional-investor only funds and Complex Product in general may have higher risk than other retail and non-complex products. Past performance is not indicative of future performance. All investments involve risks (including the possibility of loss of the capital invested) and the price of fund units may go up as well as down. This fund may invest in financial derivatives which may involve additional risks (e.g. market, counterparty, liquidity, leverage and volatility risks) and lead to higher volatility. In adverse situations, the fund may suffer significant losses. This fund is not principal protected. In the worst-case scenario, you may lose the entire invested amount. Do not invest in a complex product unless you understand and are willing to assume the risks associated with it, including (in some cases) the risk that you may lose more than the invested amount. Please refer to the “Important Information About Funds” for details of the risks involved. If you are in any doubt, you should clarify with us or seek independent professional advice.
General risk warnings relating to collective investment schemes
Before making an investment decision, you are reminded to refer to the relevant prospectus/ offering document for specific risk considerations and related fees and charges. Funds are not a bank deposit and not capital guaranteed, and is subject to investment risks, including the possible loss of the principal amount invested. Some of the funds also involve derivatives. Do not invest in them unless you fully understand and are willing to assume the risks associated with them.
Opinions
Whilst Endowus HK Limited (“Endowus”) has tried to provide accurate and timely information, there may be inadvertent delays, omissions, technical or factual inaccuracies or typographical errors. Any forward-looking statements, prediction, projection or forecast on the economy, stock market, bond market or economic trends of the markets contained in this material are subject to market influences and contingent upon matters outside the control of Endowus HK Limited (“Endowus”) and therefore may not be realised in the future. Further, any opinion or estimate is made on a general basis and subject to change without notice. In presenting the information above, none of Endowus HK Limited, its affiliates, directors, employees, representatives or agents have given any consideration to, nor have made any investigation of the objective, financial situation or particular need of any user, reader, any specific person or group of persons. Therefore, no representation is made as to the completeness and adequacy of the information to make an informed decision. You should carefully consider whether any investment views and products/ services are appropriate in view of your investment experience, objectives, financial resources and relevant circumstances. You may also wish to seek financial advice through a financial advisor or the Endowus platform and independent legal, accounting, regulatory or tax advice, as appropriate.
No invitation or solicitation
Nothing contained in this article should be construed as a solicitation, an offer to buy or sale, or recommendation, to acquire or dispose of any security, commodity, investment or to engage in any other transaction in any jurisdiction in which such solicitation, offer to buy or sale would be unlawful under the securities laws in such jurisdiction. No information included in this article is to be construed as investment advice or as a recommendation or a representation about the suitability or appropriateness of any advisory product or service; or an offer to buy or sell, or the solicitation of an offer to buy or sell, any security, financial product, or instrument; or to participate in any particular trading strategy. Investors should seek independent financial and tax advice before making any investment decision.
Product Risk Rating: Please note that any product risk rating (the “PRR”) provided by us is an internal rating assigned based on our product risk assessment model, and is for your reference only. The PRR is subject to change from time to time. The PRR does not take into account your individual circumstances, objectives or needs and should not be regarded as advice or recommendation to purchase, hold or sell any fund or make any other investment decisions. Accordingly, you should not solely rely on the PRR in making your investment decision in the relevant Fund.
This article has not been reviewed by the Securities and Futures Commission or any regulatory authority in Hong Kong.
.png)



.png)