

.webp)
.webp)
.webp)
.webp)


.webp)


%20(1).gif)

Register for the event
Endowus invites you to our exclusive event with Macquarie Asset Management, as we discuss unlocking opportunities in Infrastructure- a $1.3tn asset class.
This event is reserved for Accredited Investors (AIs) only. To register for the event, please indicate one of the following:
- Endowus Core Flagship 100% Equity Portfolio rose 3.0% in Q4 2025, performing in line with the global equities benchmark. The 100% Core Flagship Fixed Income Portfolio gained 0.9% over the quarter, outperforming the broader fixed income market which delivered 0.1%.
- All Income Portfolios delivered positive returns in Q4 and outperformed their respective benchmarks over the quarter.
- Endowus Cash Smart Portfolios continued to deliver stable positive returns in Q4, though all three portfolios registered similar performance despite differing in risk levels.
- For more on the market insights, click here.
Endowus Flagship Portfolios — Cash/SRS
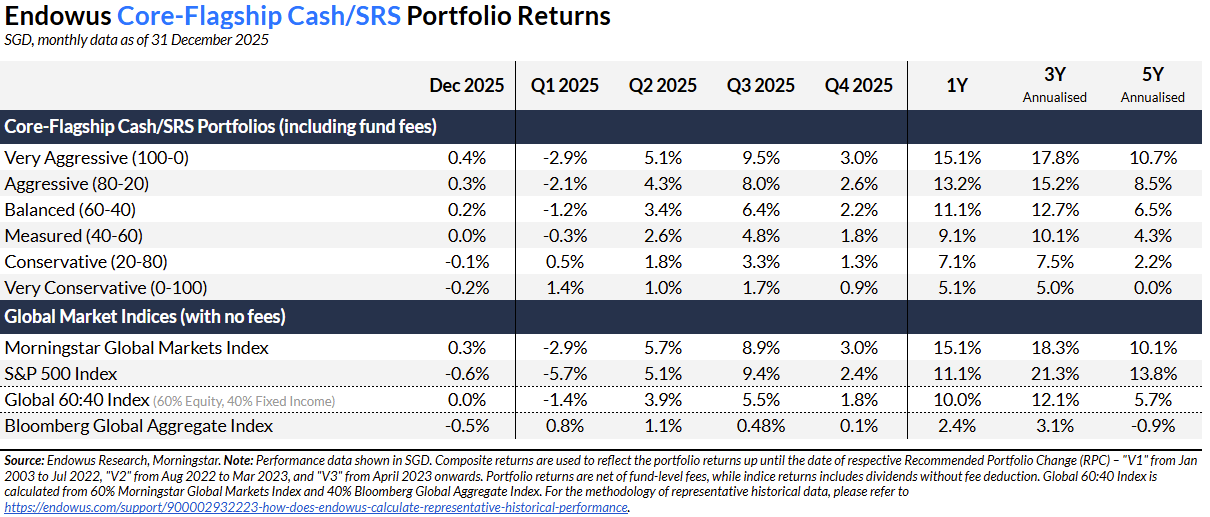
Key performance highlights:
Global equities delivered steady returns in Q4 2025, ending the quarter up 3.0%. Returns were supported by robust earnings growth and positive economic data showing the US economy grew faster than expected in Q3. Notably, non-US equities outperformed the US, driven by a weakening US dollar and a rotation away from US large cap Technology stocks over concerns of overvaluation.
The Flagship Cash/SRS 100% Equity Portfolio returned 3.0% in Q4 2025, performing in line with the equities benchmark. While the Portfolio benefitted from its overweight to value stocks, its relative performance was weighed down by its overweight to small cap stocks, which trailed the performance of large-cap stocks.
Within the Portfolio, the Dimensional Emerging Market Large Cap Core Equity Fund was the best performer, ending the quarter up 5.1%. Emerging market equities delivered robust performance in Q4 and outperformed their developed market counterparts. In contrast, the Dimensional Pacific Basin Small Companies Fund was the weakest performer, ending the quarter up 1.5%. The Fund’s overweight to Japan small cap stocks weighed on relative performance, as the Japan market rally during the quarter was concentrated in large-cap stocks rather than the small cap stocks favoured by the Fund.
Global bonds ended the quarter with a slight gain of 0.1% in Q4. The Fed continued on its rate cutting path and initiated a 0.25% rate cut in Oct and Dec, bringing the federal funds rate to the 3.5-3.75% range. Short term rates fell as a result, supporting the returns of shorter term US Treasuries. On the other hand, long term yields rose slightly, resulting in the overall steepening of the US yield curve. In credit, investment grade bonds benefited from positive government bond performance, but this was offset by the small widening in spreads.
The Flagship Cash/SRS 100% Fixed Income Portfolio was up 0.9% in Q4 2025, outperforming the global fixed income benchmark by 0.8%. The outperformance was driven by the portfolio’s overweight to emerging market bonds, which saw another quarter of good performance driven by growing investor interest that continued to support flows into the asset class.
Within the Portfolio, the PIMCO Emerging Market Bond Fund was the best performer, ending the quarter up 2.7%. Its good performance was on the back of the robust performance of emerging market bonds. On the other hand, the Dimensional Global Core Fixed Income Fund ended the quarter down 0.23%, and was the weakest performer. Its higher exposure to longer duration contributed to the underperformance.
Endowus Flagship Portfolios — CPF
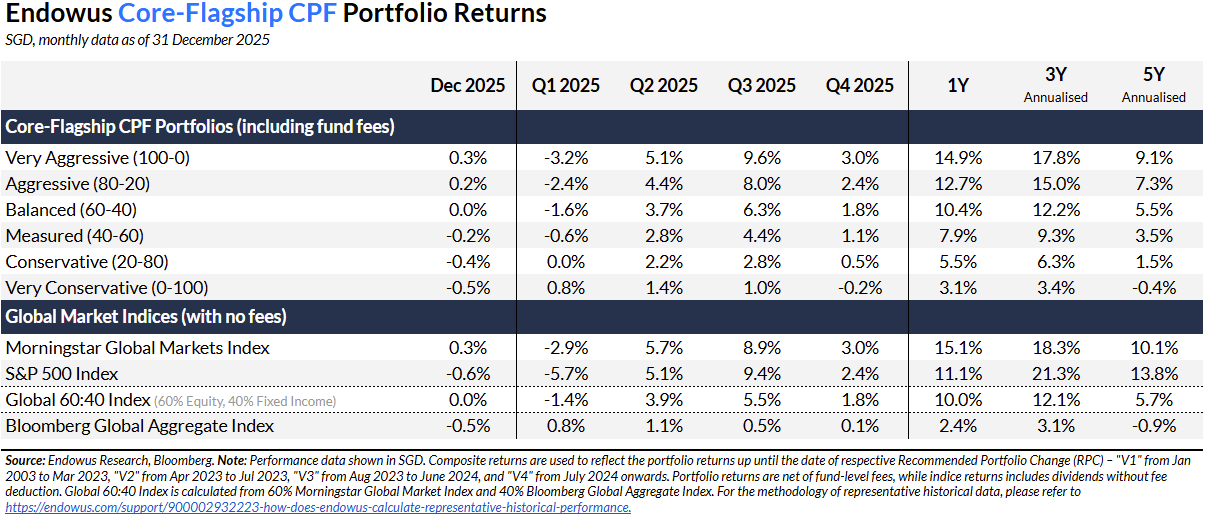
Note: The Flagship CPF Portfolio allocations were updated in July 2024 with three new funds from Dimensional.
Key performance highlights:
The Flagship CPF 100% Equity Portfolio gained 3.0% in Q4 2025, performing in line with the broader global equity market. Similar to the Flagship Cash/SRS version, while the Portfolio’s overweight to value stocks aided relative performance, its overweight to small cap stocks pared back some of those gains as they lagged their large cap peers. Within the Portfolio, the Schroder Global Emerging Market Opportunities Fund was the best performer in Q4, delivering 6.1% returns. The Fund’s robust performance was bolstered by tailwinds across the emerging market equity landscape. On the other hand, the Amundi Prime USA Fund was the weakest performer, as US equities lagged the broader equities market in Q4. The Fund ended the quarter up 2.1%.
The Flagship CPF 100% Fixed Income Portfolio fell by 0.2% in Q4 2025, underperforming the broader global fixed income benchmark by 0.3%. The Portfolio's underperformance was due to its overweight to Singapore bonds, which detracted during the quarter. The best performing Fund in the Portfolio during the quarter was the United SGD Fund, which returned 0.2% due to its shorter duration. On the other hand, the weakest performer was the Eastspring Singapore Select Bond Fund, which fell by 1.4%. The Fund suffered due to the weaker performance of Singapore bonds during the quarter.
Endowus ESG Portfolios
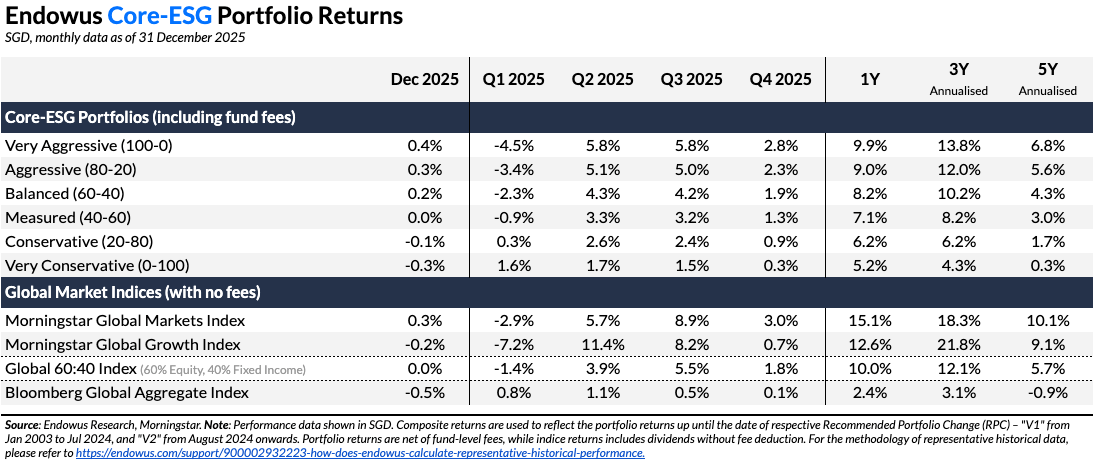
Key performance highlights:
In Q4, the ESG Equity model portfolio broadly tracked the Morningstar Global Markets Index. The top contributor was the Schroder ISF Global Sustainable Growth Fund, which gained 4.5% in Q4, benefiting from its quality-growth orientation and positive stock selection in December. The Enhanced Index funds also performed well, supported by a systematic approach and their benchmark tracking. On the other hand, the smaller regional and thematic allocations were relative detractors. The Stewart Investors funds were weighed down by a challenging November for emerging market equities amid currency volatility. The KBI Global Sustainable Infrastructure Fund also lagged as infrastructure-related names faced headwinds from rising rate expectations in December despite a stronger October.
The ESG Fixed Income model portfolio performed broadly in line with the Bloomberg Global Aggregate Index, rising approximately 0.3%. The main contributor was the PIMCO GIS ESG Income Fund, which benefitted from its diversified multi-sector approach and positive carry from higher-yielding credit exposures during a period of relatively stable spreads. The PIMCO GIS Climate Bond Fund, the portfolio's largest allocation at 30%, also contributed positively with a 0.4% return, supported by steady performance in green bonds and climate-aligned issuers through October and November before modest weakness in December. On the other hand, the Eastspring Asia Select Bond Fund was the main detractor, declining 0.4% as Asian credit markets faced headwinds from China property sector concerns and regional currency volatility.
.png)
The Endowus ESG Portfolios not only focus on financial returns but also on promoting positive societal and environmental impact. We are committed to being responsible stewards of capital, as demonstrated by our active review of ESG data to inform our investment decisions.
For instance, the ESG 100% Equity Portfolio aligns better with the United Nations Sustainable Development Goals, showcasing lower greenhouse gas emissions and enhanced board gender diversity compared to the global equities.
Our ESG 100% Fixed Income Portfolio also emphasises investments that contribute to environmental sustainability and social well-being.
The PIMCO GIS Climate Bond Fund allocates over 75% to green bonds. The PIMCO GIS ESG Income Fund tilts towards companies or issuers with positive ESG characteristics, seeks a lower carbon footprint and actively engages issuers. The Allspring Climate Transition Global Investment Grade Credit Fund targets to decarbonise the Fund by 2050 and excludes securities exposed to ESG risks.
Endowus Factor by Dimensional Portfolios
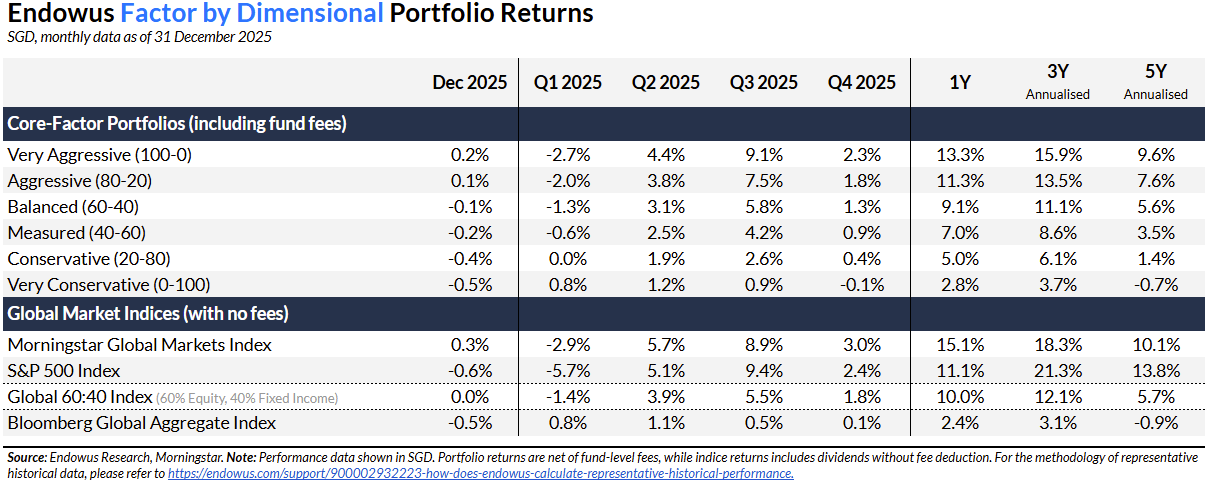
Key performance highlights:
The Factor 100% Equity and 100% Fixed Income portfolios underperformed their respective equity and fixed income benchmarks in Q4 2025.
The 100% Equity portfolio returned 2.3% in the fourth quarter, underperforming the global equity benchmark which rose 3.0%. The best performance came from the Dimensional Global Core Equity fund (60% portfolio weight), which is developed market (DM) focused with a value and small-cap tilt. While small cap stocks underperformed large caps, global value stocks slightly outperformed their growth counterparts over the quarter. The Dimensional Global Core Equity fund gained 2.8% and was broadly in-line with developed market equities.
On the other hand, the Dimensional U.S. Core Equity Fund gained 1.8%, underperforming the S&P 500 index due to its value tilt in U.S. equities which trailed U.S growth stocks during the fourth quarter. This was particularly evident in October which saw a large U.S. tech stock rally following the Fed’s restart of its rate-cut cycle.
The worst performance came from Dimensional Emerging Markets Core Equity Lower Carbon ESG Screened, which rose 1.1% in the fourth quarter and underperformed broader emerging market equities. The Fund’s small cap tilt detracted as large cap EM stocks rallied significantly in Q4, while the fund’s more diversified approach and underweight to top EM names such as TSMC and Samsung (which rallied significantly in Q4) also contributed to its underperformance.
The 100% Fixed Income portfolio declined by 0.1% in the fourth quarter, with mixed performances from the underlying funds over the three-month period. While longer duration bonds were negatively impacted by rising U.S. treasury yields, on the other hand shorter duration strategies benefited from the rally in short-term rates. As a result, the longer-duration oriented Dimensional Global Core Fixed Income fell 0.2% and underperformed the Global Aggregate, while the Dimensional Global Short-Term Fixed Income Fund outperformed the Global Aggregate, generating a 0.2% return. Besides this steepening of the curve, the U.S Investment Grade sector saw some mild credit spread widening, which limited capital appreciation in the portfolio in Q4.
Endowus Satellite Portfolios
Launched in November 2021, the Endowus Satellite Portfolios are designed to supplement the core portfolios and offer clients specific exposure to opportunities in selected regions, themes, asset classes, and trends.
In taking a core-satellite approach, most investors should allocate the bulk of their asset allocation to the core portfolios.
China Equity Portfolio
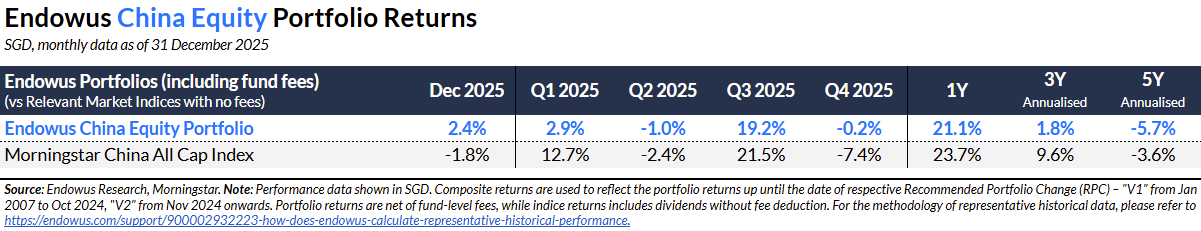
Key performance highlights:
The China Equity model portfolio posted a slight loss of 0.2% in Q4 2025.
In the fourth quarter of 2025, China's equity market entered a consolidation phase, digesting the sharp gains from the previous quarter amidst a complex macroeconomic and geopolitical backdrop. While Q3 was defined by a liquidity-driven rally, Q4 was characterized by volatility and divergence. Geopolitics took center stage early in the quarter with renewed tariff threats from the US, before sentiment stabilized following the APEC summit where Presidents Xi and Trump agreed to a one-year trade truce. Despite this diplomatic reprieve, domestic headwinds persisted; economic data remained subdued with manufacturing PMI slipping back into contraction territory and the property sector requiring continued policy triage, such as rumored mortgage subsidies, to support sentiment.
The market witnessed a distinct rotation in Q4. The "anti-involution" theme—aimed at curbing destructive price wars—continued to benefit select industries like Materials and Industrials. However, the broad-based AI and tech euphoria of Q3 faced profit-taking as investors reassessed valuations amid a more hawkish tone from the US Federal Reserve. Capital rotated markedly into defensive sectors, particularly state-owned banks, as investors sought safety against lingering macro uncertainty.
The Endowus China Equity Model Portfolio delivered a flat return of negative 0.2% in Q4 2025 , outperforming the Morningstar China All Cap Index (which fell 7.4%). T. Rowe Price China Evolution Equity Fund was the best-performing constituent fund in the portfolio, gaining 1.2%.
Looking ahead, fund managers see the market transitioning from a "rebound" phase to the early stages of a "new cycle" focused on deleveraging and high-quality growth. While the one-year US-China trade truce has removed an immediate geopolitical cliff-edge, allowing investors to refocus on fundamentals, the outlook remains nuanced. Managers are maintaining a selective approach, favoring companies aligned with government priorities—specifically technological self-sufficiency and "new consumption"—while remaining cautious of sectors heavily exposed to competitive intensity and deflationary risks.
Megatrends Portfolio
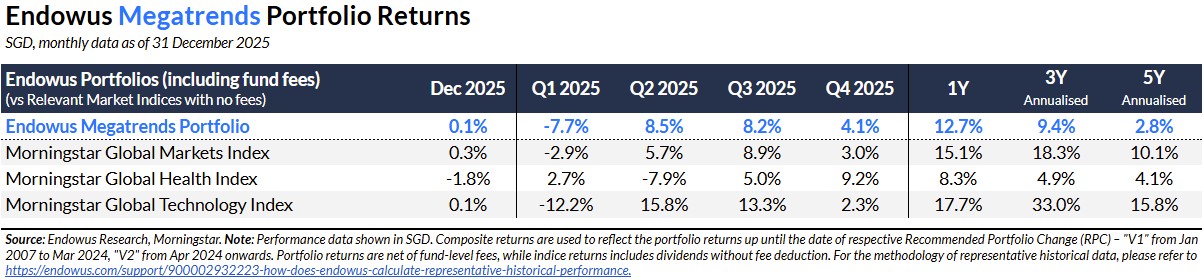
Key performance highlights:
The Megatrends model portfolio outperformed the Morningstar Global Markets Index in Q4. The standout performer was the Janus Henderson Horizon Biotechnology Fund, which delivered an exceptional 29.5% return in Q4, driven by a powerful rally in October and continued momentum in November as the Healthcare sector benefited from renewed investor interest in innovative therapeutics and favourable regulatory developments. The GMO Climate Change Investment Fund also contributed strongly, rising 8.2%, supported by robust October performance as clean energy and transition-related equities rallied.
On the other hand, the diversified thematic funds were the main detractors. The AB Sustainable Global Thematic Fund declined, weighed down by broad weakness in growth-oriented names during November and December. The Allianz Thematica Fund and Neuberger Berman Global Equity Megatrends Fund also posted modest losses, reflecting the challenging environment for multi-theme strategies during the quarter.
Technology Portfolio
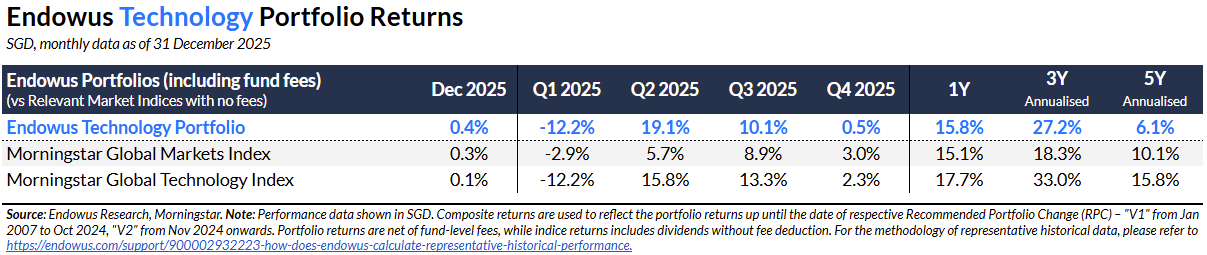
Key performance highlights:
The Technology Portfolio gained 0.5% in Q4 and 15.8% YTD. This compares to the Morningstar Global Markets Index which gained 3.0% in Q4 and 15.1% YTD, and the Morningstar Global Technology Index which gained 2.3% in Q4 and 17.7% YTD.
The Portfolio trailed global equities in Q4 2025 although it outperformed in 2025 overall. The Portfolio also trailed the global tech index in Q4 and 2025 overall.
The main detractors to relative performance this quarter were the JPM US Technology Fund, Franklin Technology Fund, and BGF World Technology Fund, which fell by 1.8%, 1.4% and 0.9% respectively. The reasons ranged from being underweight in semiconductor and equipment (for all 3 funds) as well as stock selection (for eg. Robinhood & Snowflake for JPM US Tech and ARM Holdings & Arista Networks for Franklin Templeton).
The best performer this quarter was the BGF Next Generation Technology Fund which rose 4.9%. The fund benefited from stock selection as four of their five top holdings showed strong performance in Q4. The Fidelity Global Tech Fund which is our largest weight (30%) in the portfolio also showed a solid positive 2.6% return in Q4 thanks to the PMs favored large cap positions, Alphabet, Amazon, & TSMC.
Note our portfolio has a more balanced weight of mega cap tech (51%) and large cap tech (26%) companies compared to the index, where mega cap tech accounts for 65% and large cap tech accounts for 22% respectively.
Global Real Asset Portfolio
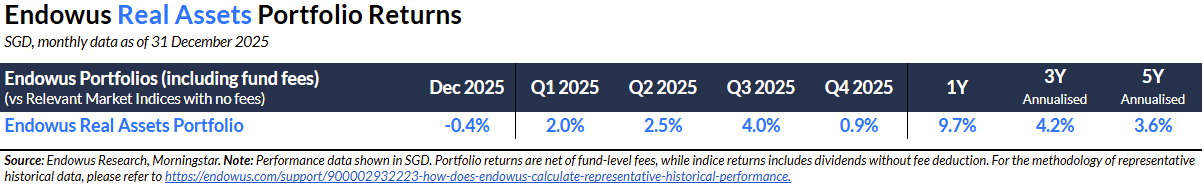
Key performance highlights:
The Endowus Real Assets portfolio eked out 0.9% positive return in Q4, bringing the full year performance to 9.7%. In the fourth quarter, the Portfolio’s exposure to listed infrastructure and real estate experienced headwind and contributed negatively to performance. This was more than offset by the Portfolio’s exposure to precious metals (gold and silver) through Ninety One Global Natural Resources Fund and to a lesser extent, PIMCO GIS Commodity Real Return Fund. Both funds delivered positive returns, benefiting from the continued strength of precious metals in the fourth quarter.
Endowus Income Portfolios
Key performance highlights:
The Stable Income Portfolio achieved a 0.8% gain in the fourth quarter, resulting in a positive 6% total return for the year. The Portfolio outperformed the broader credit market throughout all four quarters. Relative performance in the fourth quarter was notably supported by its allocation to flexible income funds, especially the PIMCO GIS Income Fund which rose 1.5%, and its exposure to Emerging Markets debt via the Neuberger Berman Short Duration Bond Fund.
The Higher Income Portfolio delivered a 1.2% gain in the fourth quarter, bringing its full-year total return to positive 7.6% and outperforming the 20-80 Equity-Fixed Income benchmark. Similar to the Stable Income Portfolio, the fixed income component outperformed the broader credit market in the fourth quarter. The equity component slightly outperformed the broader equities market. The Portfolio’s overweight exposure to Emerging Markets and Asian equities contributed positively to relative returns, though this was partially offset by the relative drag from its overweight position in real assets.
The Future Income Portfolio achieved a 1.5% gain in the fourth quarter, resulting in a full-year total return of positive 8.2%. Its fixed income component outperformed the broader credit market in Q4, mirroring the performance of the Stable Income Portfolio. However, the equity component underperformed the broader equities market. The largest detractor was the allocation to the AB Low Volatility Equity Portfolio Fund, as low volatility stocks continued to face challenges in Q4. This underperformance was somewhat mitigated by the Portfolio's emphasis on quality style and European equities, both of which performed strongly in the quarter.
Latest current target payout update:
In September 2025, we revised downwards the current target payout of Higher Income Portfolio to 5-6%. The recent increase in hedging cost between SGD and USD pair has caused certain fund managers to lower the payout, impacting the overall payout levels across all three income portfolios. This in particular has caused Higher Income Portfolio’s payout yield to dip below the prior target payout range. In light of the prevailing interest rate cycle, it is only prudent to lower the current target payout range of the Higher Income Portfolio.
Investment grade flexible income funds continue to be able to generate income that’s akin to high yield funds in the current environment where high yield spreads are particularly tight. In light of this, we are comfortable with the Higher Income Portfolio generating an income level that is similar to that of Stable Income. It is important to note that the Higher Income Portfolio has delivered better growth in terms of total return than Stable Income, with the prudent addition of credit and equity risk. This means that after receiving the income, investors in the Higher Income Portfolio would have seen a stronger increase in their capital in 2025.
We are monitoring and will take actions to improve the portfolios if we believe there are better building blocks/ is room to optimise the portfolios further.
Endowus Cash Smart Portfolios
Key performance highlights:
The Cash Smart portfolios delivered consistent, positive returns in Q4 2025.
With the weaker-than-expected U.S. jobs growth in October pointing to a cooling labour market, and Core CPI falling to almost a five-year low in November, the FED lowered the federal funds rate twice in Q4 last year. This brought the overnight rate down to 3.50 - 3.75%. As a result, short-term rates fell significantly over the quarter (the 3-month rate fell 31bps), while long-term yields rose slightly leading to a steepening of the U.S. yield curve.
With the Fed cutting rates, Singapore short-term rates (3-month and under) fell slightly during the quarter, while longer tenors (6-month and above) picked up. The MAS kept its policy stance steady on the back of stronger GDP growth and domestic fundamentals.
This constructive backdrop for U.S. and SG rates provided tailwinds for money market securities. On the other hand, short duration bonds saw limited capital appreciation during the quarter, with credit spreads widening slightly in the U.S. Investment-grade and Asia/EM sectors.
Cash Smart Secure closed the fourth quarter up 0.4%. This performance was supported by consistent monthly returns throughout the October to December period. The two underlying funds in the portfolio, Fullerton SGD Cash Fund and LionGlobal SGD Enhanced Liquidity Fund, delivered steady growth during the quarter amidst the lower SG rate environment. Secure remains a relatively safer option across the Cash Smart suite for investors seeking shelter for their investments while generating short-term yield.
Cash Smart Enhanced generated a return of positive 0.3% in the fourth quarter. All underlying funds generated positive returns, with the LionGlobal SGD Enhanced Liquidity Fund delivering the strongest performance over the quarter. On the other hand, the UOB United SGD Fund was flat in November and December, impacted by the slight widening in credit spreads. With a slightly added risk, the Enhanced portfolio takes on slightly more credit risk than Secure with its higher exposure to short duration bonds.
Cash Smart Ultra generated a return of 0.4% in the fourth quarter. All underlying funds generated positive returns, with most funds up between 0.2% to 0.4% over the quarter. The best performance came from PIMCO Low Duration Income Fund up 1.3%, which benefited from its more global portfolio across various fixed income sectors, including exposure to Agency MBS that delivered strong returns. With a higher added risk than Enhanced or Secure, Ultra has a potential to produce higher returns. Investors seeking to largely avoid exposure to market volatility may consider switching to lower-risk portfolios such as Secure or Enhanced.
Cash Smart Portfolios, primarily exposed to USD and SGD market rates, are starting to see some divergence in yield movements as short rates fall and longer yields start to pick up, even as markets remain in a rate-cut environment. Given the varying levels of duration and credit risk across the portfolios, investors are encouraged to review their investment goals and assess whether their current Cash Smart Portfolio remains aligned with their needs.
Endowus Q1 & March 2025 Portfolio Performance Review

Endowus Q3 2024 Performance Review

Endowus Q2 2024 Performance Review
.jpg)


%20F1(2).webp)

.webp)


.webp)