

.webp)
.webp)
.webp)
.webp)


.webp)


%20(1).gif)

Register for the event
Endowus invites you to our exclusive event with Macquarie Asset Management, as we discuss unlocking opportunities in Infrastructure- a $1.3tn asset class.
This event is reserved for Accredited Investors (AIs) only. To register for the event, please indicate one of the following:
- Our ESG equities portfolio generated solid returns of +6.9% for the quarter and was our best performing equities portfolio for Q2 2021.
- Our Cash/SRS equities portfolio had a strong quarter of performance of +6.7%, putting YTD performance at +15.7%, and 12 month performance at +36.2%.
- Our CPF equities portfolios also generated +6.7% for the quarter, putting YTD performance at 13.2%, and 12 month performance at +34.3%.
- Our fixed income portfolios have generally rebounded well during Q2 with all the portfolios generating positive returns, after struggling from a rising interest rate environment in the previous quarter.
- Concerns of inflation and uncertainty from COVID-19 did not stop the upward trajectory of equity markets with a strong growth rebound but concerns of inflation and policy tail risks are rising.
- Trying to time the market and practising active asset allocation can only lead to inconsistent performance as some other robos have shown.
- Having broad-based global diversification in your core portfolios and strategically passive asset allocation is the tried and tested way to generate consistent returns over time.
The Endowus Investment Office Q2 2021 Market Commentary
“July: This is one of the peculiarly dangerous months to speculate in stocks. The others are October, January, September, April, November, May, March, June, December, August and February.” - Mark Twain
The summer season is upon us in the Northern Hemisphere, and that means hurricanes and typhoons with accompanying monsoons across large parts of the region. While there tends to be a lot of hoopla about oncoming typhoons, many do not make landfall or peter out in the middle of the ocean creating no meaningful damage to mankind. Similarly, the brewing storms of the COVID-19 crisis and the forecasts of impending disaster never really materialised. And while we had hopes that it would be very much behind us by now, we are in fact still trying to shake off the recurring formation of new variants and outbreaks.
The whirlwind of the pandemic has left behind the debris of growth concerns, persistent unemployment, widening income inequality, meaningful inflationary concerns and the spectre of rising interest rates and tightening liquidity. Just like most typhoons, while some damage may have been done to financial markets, the trajectory of these naturally occurring phenomena is one of limited long-term damage. We surmise that many of the concerns that cause panic in markets are rarely of any lasting impact.

Endowus Q2 2021 Portfolio Performance
Cash/SRS Core Advised Portfolios
Key Performance Highlights: Equities had another quarter of strong performance up +6.7%, adding to the 8.5% in Q1 and is now up 15.7% YTD. Fixed income rebounded with a positive +1.8% return after falling in 1Q.
In Q2 2021, the underlying funds in the fixed income asset allocation did well by outperforming markets, generating excess returns for our fixed income portfolios. Equities portfolios were up a strong 6.7% tracking the broad market strength. It lagged the broader market slightly given the factor tilts in our portfolio towards value and small cap in an environment that favored large cap growth stocks, after blowing the lights out in Q1.
Nonetheless, on a year-to-date basis, our equity portfolios still registered a strong outperformance riding on the waves of rotation during Q1. While it’s hard to predict market dynamics and factor rotations, empirical evidence reinforces our belief that factor tilts towards the long-term proven factors of return such as value, small cap and profitability will drive excess returns in the long run.
On fixed income, our portfolio performed well with meaningful benchmark outperformance despite increased volatility and what has been a challenging time for investors. The overall portfolios have managed risk well and delivered strong performance that reflect its passive strategic asset allocation focus.

CPF Core Advised Portfolios
Key Performance Highlights: Strong quarterly performance tracking the Core cash portfolios with the same 6.7% return following a 6% return in Q1 resulting in a 13.2% return YTD. Fixed income rebounded with a positive return of +0.8% after falling in Q1.
Our CPF portfolio (Aggressive 100-0) continued to rise in the first quarter bettering the 1Q performance of +6% to reach a quarterly return of 6.7%. Tracking the global market strength of the year. This trails the benchmark slightly due to the drag from Asia and Emerging markets and Europe. That being said, underlying equity funds that make up our CPF portfolio, at 13.2% YTD, have contributed to a return that is well above the 2.5% that CPF-OA yields.
Within fixed income, riskier options such as high yield bond funds are excluded from the CPF-IS scheme. This has resulted in limited options for diversification across fixed income sectors with a resultant overweight on investment grade bonds and an underweight on high yield. However, the portfolio rebounded to post a positive return of 0.8%
The low interest rate environment and compressed spreads is challenging for investment grade bonds and our sectoral underweight limits our upside capture. As such, our 100% Fixed Income portfolio returned slightly below the benchmark returns. While the absolute return was positive, it remained negative YTD due to the fall during Q1 when rising interest rates hurt the long duration exposure. We have seen a good steady recovery since then.

ESG Portfolios
Key Performance Highlights: Our ESG equities portfolio generated solid returns of +6.9% for the quarter and was our best performing equities portfolio for Q2 2021. This is after lagging the other portfolios a little in 1Q but shows that the ESG portfolio does not give up on performance. ESG Fixed income portfolios also rebounded with a +0.9% return and have continued to outperform the benchmark and other portfolios showing the great potential for the ESG bond portfolio.
ESG portfolios continued to generate positive returns and did better than the Cash and CPF portfolios by generating +6.9% during 2Q . This follows a first quarter return of 4.7% which was a good return but lagged the other portfolios. The YTD numbers are catching up with the other portfolios and benchmark returns. As ESG funds are underweight on energy and commodities, it lost out from the sectors’ outperformance in 1Q.
However, the fixed income ESG portfolios have outperformed the indexes as well as the other core portfolios rebounding +0.9% for the quarter and almost erasing the YTD losses. It is the best performing fixed income portfolio at Endowus.
Energy stocks, majority of which are oil and gas companies, often pose significant environmental and social risks, and therefore lag in the shift towards being ESG compliant. For this reason, they are widely excluded from ESG funds as part of their negative screening process. Putting aside the cyclical outperformance of the energy and basic materials sector which have resulted in slightly below benchmark year-to-date returns, calendar year returns for the years 2020, 2019, 2018 and beyond have been superior. This demonstrates the importance of long-term investing to avoid locking in drawdowns brought about by short term cyclical shifts towards sectors that are riskier on an ESG front.

How have Endowus portfolios done versus portfolios from other robo-advisors?
Another common question we get from our investors or at our webinars is how we stack up against alternative investment options and competitors. While we do not know what the exact comparative performance against other robo-advisors’ portfolios are, there have been an increasing number of people sharing how their portfolios from Endowus and other robo-advisors have performed. Based on these comparisons, other robos have consistently underperformed, while Endowus advised portfolios have had consistent performance that tracks passive benchmarks.
We owe our consistent outperformance of our peers to our investment philosophy, and we do not try to “beat the market” like the others, because trying to beat the market has empirically resulted in investors underperforming the benchmark over time. Both the two major robos that many people have compared our portfolios against have, at different periods of time, experienced meaningful underperformance against our portfolios, and their active management strategy is probably the root cause.
We highlight two articles from prominent bloggers. An Investment Moats article here in March (where Endowus clearly tracks the benchmark performance and since then have beaten all three other digital platforms to which it was compared to), and a Seedly article shared by an investor in all three platforms here, which show that Endowus beat both its competitors shown in the article over 1Q and 2Q and also YTD. Moreover, Endowus is the only player that has delivered a positive return every single month during the first 6 months of the year for this client versus each of the other players reporting 2 negative months each and significantly underperforming both Endowus and every single benchmark that exists.

1H 2021 Market Updates
Where is the economy in terms of growth recovery?
With some form of normalisation in the larger economies (in particular developed ones), global growth has continued its sharp rebound from the depths of the economic doldrums caused by the pandemic. While China and Asia fared better, the US has since shown a very strong rebound with growth accelerating in other major regions such as Europe. However, there are continued concerns of recurring outbreaks of new variants - such as the Delta variant that is spreading at a rapid pace again (and the relatively new Lambda) - and the lack of a strong employment recovery in major economies.
Growth trajectory shows sharp rebound followed by moderation

Q2 2021 had a number of significant market events which were noteworthy. The June Federal Open Market Committee (FOMC) meeting marked a change in the Federal Reserve (Fed) positioning since the COVID-19 crisis began, with what the market perceived to be a more hawkish policy stance than expected. Fed chair Powell and many of its members have talked about the current bout of inflation that has caused this hawkishness as being transitory in nature. However, the markets’ reaction on high inflation suggests that the market may be underestimating the inflation tail risk. This has continued to be a concern in the market.
1H 2021 Global equity market performance
Global equity markets have continued to rise higher with the US leading the way (Figure 6). The S&P 500 delivered the best return of +8.7% over the last quarter, owing to growth stocks rebounding supported by a strong Q1 earnings growth of 47% YoY and expectations of continued fiscal support especially with the passing of Biden’s infrastructure bill. European equities followed closely behind, recording a +7.1% return.

Emerging markets equities on the other hand, have lagged in comparison to its DM counterparts (Figure 7). This can be attributed to slower vaccination rollouts and the increased transmissibility of the Delta variant, along with fears of policy tightening by the Fed in light of soaring inflation. Nonetheless, EM equities rose by +5.1% driven by healthcare, energy and industrial sector outperformance.
From a factor perspective, we have seen a rotation back to growth most prominently in June, specifically that of mega cap growth stocks (Figure 8) which have benefited from resurgent doubts on the strength of the post-pandemic boom. Mega cap tech stocks outperformed the S&P 500 for the month of June, and this revival of tech stocks and shift away from value also reflects growing investor consensus that rates will indeed remain low - owing to consistent reassurance by the Fed. This has manifested in the 10 Year US Treasury bond yield, retracing from recent highs sharply during the second quarter.

Emerging Market debt takes the spotlight
Despite high levels of growth and inflation, interest rates in the US are likely to hover at the lower bound of zero interest rates until the Fed sees meaningful trajectory of improvement in the employment numbers. Low interest rates are not unique to the US with Eurozone and Switzerland rates hovering in negative territory. This backdrop is further amplified by elevated inflation, putting real returns under pressure and making the search for yield especially challenging for fixed income investors.
From a valuations perspective, fixed income remains relatively expensive with spreads significantly compressed compared to the historical 10 year average (Figure 9). Investors will have to take on a bit more risk in the search for yield in order to generate a reasonable income. This, coupled with the low interest rate environment, has nudged investors towards credit over sovereign debt.

Within fixed income, Emerging Market debt performed well during Q2, registering a solid performance of 3.9% (Figure 10) supported by stronger credit fundamentals, positive trade balances and relatively undervalued currencies. This increases its relative defensiveness compared to what we have seen historically, making it an attractive option for investors.

Outlook for 2H 2021
Tail Risks are Evolving
Moving forward, COVID-19 will become less of a tail risk for investors. From the chart below, the progress of having a sizable percentage of the population vaccinated with one dose of the COVID-19 vaccination has been tremendous over the past quarter. The US, Europe and UK have more than 50% of the population already protected by one dose. The daily increase in cases has also declined, even though there is still worry that the summer season will bring about an uptick in cases due to the highly infectious Delta variant.

A recent sentiment survey from BofA covering 270 global fund managers who are responsible for USD 805bn of assets under management shows what would be considered key tail risks currently. Inflation and taper tantrum are ranked the highest while asset bubbles and a China slowdown have also emerged as potential areas of concern.

Stay diversified as diversification benefits apply regardless of market cycles

Since 2006, we have seen many market corrections and crashes only to see the market then rebound again to achieve new highs. As we progressed through the different stages of the market cycle, the balanced portfolio remained resilient. It provided superior risk-adjusted returns compared to any actively managed portfolios. The mostly negative correlation between stocks and bonds during this period has helped to reduce risk in a portfolio and provide diversification benefits. Again highlighting why a broad globally diversified portfolio that has a strategically passive asset allocation should be preferred to an actively managed asset allocator driven by macroeconomic vagaries that is impossible to predict. The only time the correlation between stocks and bonds turns positive is in times of persistently high inflation during the 1970s.

Government bonds still have a place within the portfolio as the correlations of government bond returns are negative to that of equities and they play an important role as a hedge for investors. Even with the addition of corporate bonds to a portfolio, the diversification benefit would be helpful as the correlation to equity returns is relatively low.

When’s the best time to invest in markets?
Investors always ask the question, “Is this a good time to invest?” and try to pick the right week, month or season to invest in. They are trying to figure out a way to beat the market or another way to put it, time the market. One investor website puts seasonality when investing as follows: “The stock market is subject to a seasonal effect, in that at certain times of the year, month or even week, share prices can rise or fall.” Not much to add to that one as it pretty much covers every eventuality.
Some have tried to figure out a period of the year when it is “good to be invested in the market”. People have even come up with commonly used phrases such as “sell in May and go away”. Apart from the fact that any investment strategy that can be summed up in a short rhyme is probably not a good one, in the past two years (2019 & 2020), had you sold in May then you would have missed out on two of the best periods of market returns historically.
Also, on average historically while November to April did perform better at 5.2% than May to October which averaged 2.1%, had you remained invested for the full year, you would have gotten a 7.3% return. In fact, this may not seem like much of a difference, but if you invested $1mil during May to October and went to cash for the remainder of the year, and compared that to being fully invested throughout the year, it would be a stark difference. If we use the Dow Jones index from 1896 to 2020, $1mil invested during May and October only would have ended up being $164M which is still great, but if you had chosen not to do anything and left it in the markets without touching it throughout the year, then the amount would have compounded to a phenomenal $647M. It just goes to show that not only is every year different, but staying invested in markets over the long term has always generated better outcomes. As a client of Endowus or a regular reader of Endowus Insights, you would know that we espouse time in the market, versus timing the market.
Market returns of $1M invested seasonally vs full year (1896~2020)

Staying Invested
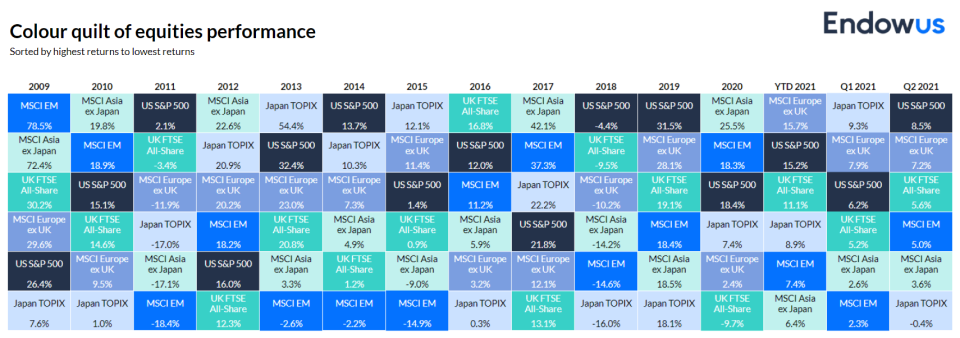
Asset class and sectoral returns vary across market cycles and even within each quarter. With evolving tail risk and an expected increase in market volatility, betting on the right horse has never been more difficult. Empirical evidence suggests that market timing does little to influence long-term returns, and that consistent performance through active management in asset allocation, as espoused by many other robo advisors, is near impossible.
At Endowus, we emphasise the importance of staying invested in a globally diversified portfolio across different asset classes and sectors. We believe this is the most effective and cost-efficient way to earn the best risk-adjusted returns in the long run. While you inevitably may experience short-term drawdowns due to volatility, the market portfolio will most definitely increase in value over time. That is the power of markets.
Webinar: Travel, market and crypto bubbles
.png)
We are heading into bubble trouble

Endowus 2020 review and 2021 outlook


%20F1(2).webp)

.webp)


.webp)