
Register for the event
Endowus invites you to our exclusive event with Macquarie Asset Management, as we discuss unlocking opportunities in Infrastructure- a $1.3tn asset class.
This event is reserved for Accredited Investors (AIs) only. To register for the event, please indicate one of the following:
In the third quarter of 2026, markets turned more volatile, reversing the calm that had prevailed at the end of the second quarter. The US-Iran ceasefire signed on June 17 was swiftly broken in early July, and as a response, oil surged back above USD100. In addition, the AI hardware trade saw a sharp reversal, which caused the momentum factor to crash in July.
Central banks turned hawkish. In September the Fed, ECB and the BOJ all raised rates, with the Fed delivering its first hike since 2023. Long dated government bond yields rose to multi-decade highs, and the US 10-year Treasury yield crossed 5% for the first time since 2007.
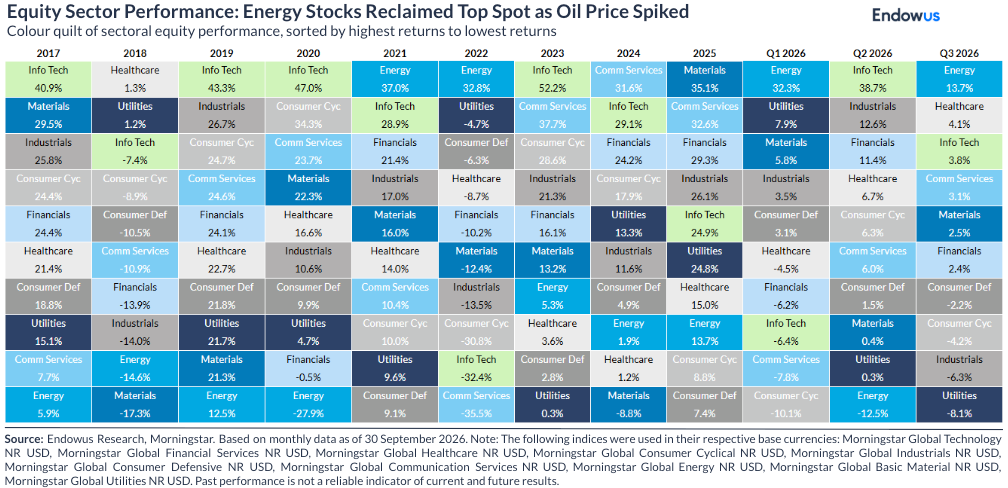
Headline equity returns masked large swings beneath the surface. Global equities finished the quarter roughly flat with the S&P 500 rising 2.2% and EM slipping slightly. Energy was the clear winner while semiconductors, small caps and rate-sensitive sectors (such as utilities) lagged. Bonds had a difficult quarter with high quality fixed income falling 3-4%.
The quarter was dominated by a pronounced selloff at the long end of the yield curve, driven by rising inflation expectations and solid GDP growth data. While higher rates are typically negative for equities, their effect was offset by S&P 500 earnings, which held up better than expected, largely due to AI and to the abovementioned solid growth data.
Global equity
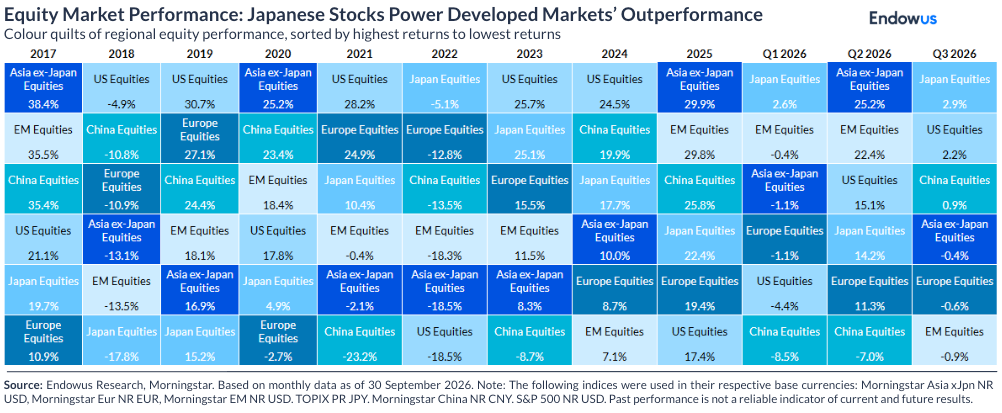
Global equities rose 1.2% in Q3 after Q2’s 14.7% surge, bringing its year to date (YTD) returns to 12.7%. But the modest headline quarterly performance masked an underlying composition that was anything but. Throughout the quarter, there were aggressive sector rotations. By region, Japan equities were the best performer thanks to exporters and financials and a recovering yen after the July US-Japan yen intervention.
US equities rose about 2.2% for the quarter with the S&P 500 closing only 2% below its all-time high. The tech sector was strong thanks to the performance of the five mega caps (Microsoft, Nvidia, Apple, Meta and Palantir), which mitigated weakness in the semiconductor sector. Given the narrow breadth, the equal weighted picture was far weaker, with the S&P 500 equal weight index falling 1.9% and the Russell 2000 Index falling 7.2%.
The AI trade cooled meaningfully. After its record Q2, the semiconductor complex fell 11.2% in Q3. Two episodes stood out: a crowded-trade unwind in late July, and a sharp sell-off on 14 September after leading AI developers, including Anthropic's CEO, publicly called for a slower pace of AI capability development on safety grounds. Software and platform names held up, as cloud and AI revenue growth continued to beat expectations.
At the sector level, energy was the standout, rising 13.7% on the back of the oil rebound. Technology, healthcare and communication services also finished positive. Utilities, industrials and real estate were the weakest sectors, hurt by rising yields. Value outperformed growth, and momentum—the big winner of Q2—reversed sharply.
Emerging markets slipped about 0.9% in Q3 but remain the best-performing region YTD, up more than 20%. The North Asian chip markets that led Q2 bore the brunt of the reversal. Korea's KOSPI suffered its steepest monthly fall on record in July, at one point down almost 40% from its June peak. SK Hynix's results, though showing a sixfold profit rise, missed the loftier expectations, and the unwinding of leveraged retail positions amplified the decline. Korea ended the quarter down about 7.8% on a USD basis (and 19.2% on local currency basis) but is still up roughly +74.0% YTD on a USD basis. Taiwan proved more resilient, finishing the quarter up about 4.8%.
Elsewhere in Asia, Hong Kong stocks posted solid gains, fueled by growing enthusiasm for offshore shares as these companies tend to be less exposed to AI hardware. Singapore stocks also registered robust gains, supported by the strong performance of bank stocks and resilient economic growth. On the other hand, India fell as foreign investors withdrew capital, while Brazil rallied in July and September.
Developed markets outside the US were mixed. Japan was the strongest major region and Europe the weakest, weighed down mainly by higher energy prices and an ECB rate hike.
Global fixed income
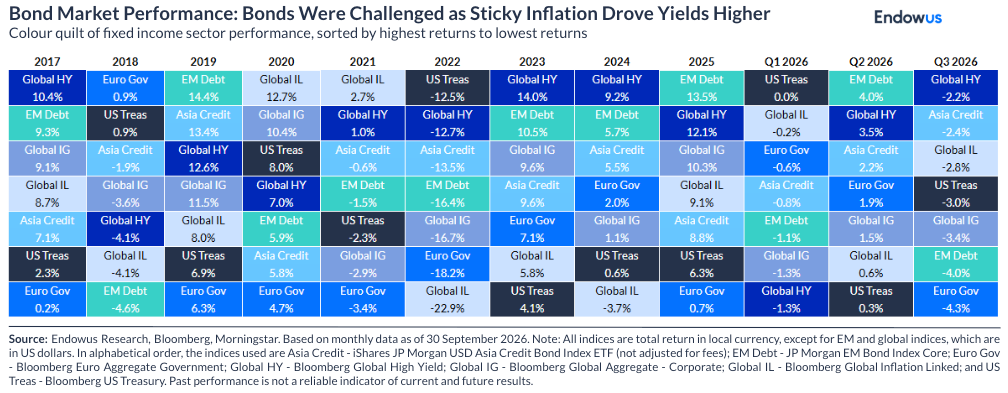
Q3 was a difficult quarter for bonds. The 10-year US Treasury yield rose 82 basis points to 5.28% by 30 September, crossing 5% in mid-September for the first time since 2007 (except the brief trough in 2023). The 30-year yield ended the quarter at 5.63%—its highest since 2004—and the 2-year yield finished at 4.89%. The curve steepened, with the gap between 2- and 10-year yields widening from 29 to 41 basis points. Rising term premium played a large role, reflecting fiscal concerns as US federal debt passed USD40 trillion, but also expectations for continued growth. Long-dated yields also hit multi-decade highs in the UK, Germany, and Japan.
The Bloomberg Global Aggregate Index fell 2.5% in Q3, taking its YTD return to negative 1.4%. Longer-duration assets predictably took the brunt of the hit. Global IG fell about 3.4% as their longer duration outweighed stable spreads (which remain near historical tights). High yield held up better, falling approximately 2.2%, supported by higher starting yields and shorter duration. Short-dated bonds were the most resilient segment of the market.
While bonds had a challenging quarter mainly from rising yields, starting yields are now at their highest levels in decades, and historical empirical studies have shown that starting yields are highly correlated to future returns for high quality bonds. The US Aggregate yields about 5.5%, investment-grade corporates about 6.1% and US high yield about 8.1%, with real yields positive across the curve.
Commodities
Oil was again the defining commodity story, with Brent rising 42% over the quarter. It started July near USD72, then jumped above USD95 as the ceasefire collapsed, and came close to USD110 in mid-September after attacks on Gulf shipping. Tight refining margins also pushed US diesel prices to record highs, adding to energy inflation pressure.
Gold edged higher after its Q2 sell-off, rising about 3.7%. A strong August rally was largely reversed in September, when gold fell almost 7% as real yields rose and the Fed hiked, but the bullion still closed the quarter at USD4,157/oz. Gold miners were among the best-performing equity segments, up about 17.0%.
The US dollar was broadly stable, with the DXY up about 0.3% over the quarter to 101.5. The yen was the most volatile major currency, depreciating to a 1986 low (163.9) in July before recovering after the joint intervention and the BOJ's September hike. EUR and GBP weakened in September, and the Indian rupee fell as foreign investors withdrew.
Note: Figures in this article are based on Morningstar and Bloomberg data.
Webinar: Travel, market and crypto bubbles

We are heading into bubble trouble

Endowus 2020 review and 2021 outlook