

.webp)
.webp)
.webp)
.webp)


.webp)


%20(1).gif)

Register for the event
Endowus invites you to our exclusive event with Macquarie Asset Management, as we discuss unlocking opportunities in Infrastructure- a $1.3tn asset class.
This event is reserved for Accredited Investors (AIs) only. To register for the event, please indicate one of the following:
- Endowus Core Flagship portfolios rebounded in Q2 2026. The Flagship 100% Equity Portfolio gained 14.7% during the quarter, though it slightly underperformed the global equities benchmark which rose 15.0%. The Flagship 100% Fixed Income Portfolio gained 1.7% and outperformed the global fixed income benchmark which rose 0.6%.
- Income Portfolios delivered positive returns during the quarter, though they either performed in line or underperformed their respective benchmarks. Stable Income gained 1.2% and performed in line with the broader credit market. Higher Income gained 3.8% but underperformed the 20-80 benchmark which gained 3.9%. On the other hand, Future Income had the strongest gain of 5.9% due to its larger equity allocation, but it underperformed the 40-60 benchmark which gained 6.6%.
- Cash Smart Portfolios delivered positive returns during the quarter and performed according to their respective risk levels. Cash Smart Secure and Cash Smart Enhanced rose 0.3% and 0.5% respectively. As for Cash Smart Ultra, it ended the quarter up 0.6%.
- For more on the market insights, click here.
Endowus Flagship Portfolios — Cash/SRS

Key performance highlights:
The second quarter of 2026 witnessed favourable tailwinds for global equities. Firstly, ceasefire negotiations between the US and Iran made progress, and a Memorandum of Understanding to end the conflict was signed in June. Energy prices retreated and investor sentiment improved as a result. Secondly, there was a resurgence in AI optimism which drove the performance of Technology companies, specifically those related to AI hardware. Lastly, corporate earnings also continued to remain strong and resilient. Overall, global equities ended the quarter up 15.0%.
The Flagship Cash/SRS 100% Equity Portfolio gained 14.7% during the quarter, slightly underperforming the global equities benchmark. The Portfolio underperformed mainly due to its overweight to value stocks, which lagged their growth counterparts during the quarter. Further underperformance was mitigated by the Portfolio’s overweight to emerging market equities, which saw robust performance led by technology focused markets such as Korea and Taiwan.
Within the Portfolio, the Amundi Core MSCI Emerging Markets Fund was the best performer thanks to the strong performance of emerging market equities. The Fund ended the quarter with a robust 24.4% gain. On the other hand, the Dimensional Pacific Basin Small Companies Fund was the weakest performer, ending the quarter up 8.7%. The Fund lagged its global peers due to its overweight to Japan small cap stocks, as well as Australia stocks.
Global bonds remained volatile in Q2 as fears of persistent inflation continued, driven by high energy prices linked to the Middle East conflict. Against this backdrop, US Government bond yields rose to multi-year highs before reversing when a ceasefire agreement appeared in sight. The Federal Reserve also left interest rates unchanged at 3.50%-3.75% during the quarter, as Fed officials highlighted that inflation remained elevated while growth was strong. In credit, robust corporate earnings led to a tightening of both investment grade and high yield credit spreads, leading to their outperformance over government bonds. Overall, global bonds ended the quarter up 0.6%.
The Flagship Cash/SRS 100% Fixed Income Portfolio rose 1.7% during the second quarter, outperforming the global fixed income market. The Portfolio’s outperformance was driven by its overweight to emerging market bonds, which benefited from spread compression and healthy yields that attracted inflows.
Within the Portfolio, the iShares Emerging Markets Government Bond Index Fund was the best performer, ending the quarter up 4.9%. The Fund passively tracks the emerging market government bond index which saw robust performance, and further benefited from the USD appreciation against SGD during the quarter. In contrast, the iShares Global Aggregate 1-5 Year Bond Index Fund was the weakest performer, ending the quarter up 0.3%. The Fund lagged its global peers due to its slight underweight to credit.
Endowus Flagship Portfolios — CPF
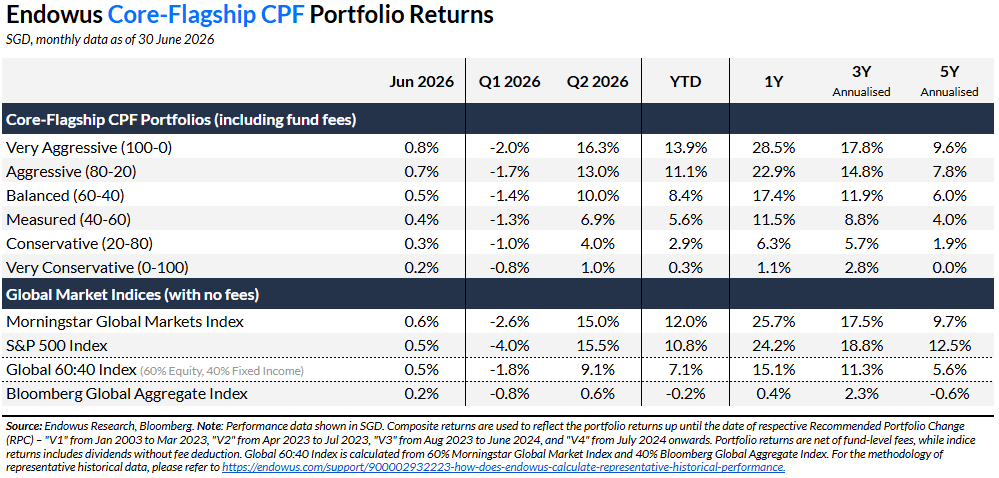
Note: The Flagship CPF Portfolio allocations were updated in July 2024 with three new funds from Dimensional.
Key performance highlights:
The Flagship CPF 100% Equity Portfolio gained 16.3% in Q2 2026, outperforming the broader global equity market which rose 15.0%. The Portfolio’s outperformance was driven by its overweight to US and emerging market equities, both of which benefited strongly from the renewed enthusiasm in AI and strong corporate earnings.
Within the Portfolio, the Schroder Global Emerging Markets Opportunities Fund was the best performer during the quarter, where it rose 28.3%. The Fund’s focus on emerging market equities as well as its stock selection contributed to its robust performance. On the other hand, the Dimensional Global Core Equity III Fund was the weakest performer. The Fund ended the quarter with a 12.6% gain, lagging its global peers due to its overweight to value stocks.
The Flagship CPF 100% Fixed Income Portfolio advanced by 1.0% in Q2 2026, outperforming the broader global fixed income market which rose 0.6%. The Portfolio benefitted from its overweight to Singapore bonds via the Eastspring Singapore Select Bond Fund. The Fund was also the best performing fund during the quarter, where it gained 2.8%. In contrast, the United SGD Fund was the weakest performer, ending the quarter up 0.6%.
Endowus ESG Portfolios

Key performance highlights:
In Q2 2026, the ESG 100% Equity Portfolio delivered a strong return of 14.6%, though it slightly underperformed the broader global equity market. The portfolio’s tilt toward emerging markets and Asian equities bolstered relative performance, as these regions saw stellar gains driven by optimistic sentiment and robust investor demand for AI-related sectors, such as semiconductors. Conversely, exposure to sustainable infrastructure via the KBI Global Sustainable Infrastructure Fund lagged, which weighed on relative performance.
The ESG 100% Fixed Income Portfolio gained 1.5% in Q2, outperforming the global fixed income benchmark. The JPM Global Bond Opportunities ESG Fund was the primary contributor to performance during the quarter (+3.2%), with notable support from the Eastspring Asia Select Bond Fund. The portfolio’s higher exposure to credit markets proved beneficial, as the environment was conducive to credit, while duration exposure faced headwinds.

The Endowus ESG Portfolios not only focus on financial returns but also on promoting positive societal and environmental impact. We are committed to being responsible stewards of capital, as demonstrated by our active review of ESG data to inform our investment decisions.
For instance, the ESG 100% Equity Portfolio aligns better with the United Nations Sustainable Development Goals, showcasing lower greenhouse gas emissions and enhanced board gender diversity compared to the global equities.
Our ESG 100% Fixed Income Portfolio also emphasises investments that contribute to environmental sustainability and social well-being.
The PIMCO GIS Climate Bond Fund allocates over 75% to green bonds. The PIMCO GIS ESG Income Fund tilts towards companies or issuers with positive ESG characteristics, seeks a lower carbon footprint and actively engages issuers. The Allspring Climate Transition Global Investment Grade Credit Fund targets to decarbonise the Fund by 2050 and excludes securities exposed to ESG risks.
Endowus Factor by Dimensional Portfolios
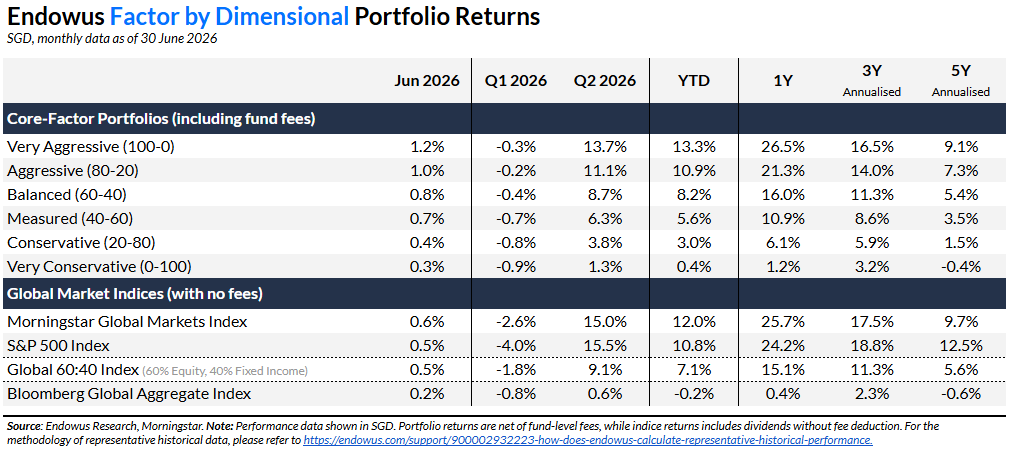
Key performance highlights:
The Factors 100% Equity Portfolio gained 13.7% in the second quarter, but underperformed the global equity benchmark which rose 15.0%. The Portfolio’s overweight to value stocks contributed to the underperformance, as value stocks underperformed their growth counterparts during the quarter. Within the Portfolio, the Dimensional Emerging Markets Core Equity Lower Carbon ESG Screened Fund ended the quarter with a 18.9% gain and was the best performer. The Fund’s focus on emerging market equities drove its strong performance. In contrast, the Dimensional Pacific Basin Small Companies Fund was the weakest performer, ending the quarter with a 8.7% gain. The Fund lagged its global peers due to its emphasis on Japan small cap stocks, as well as Australia stocks.
The Factors 100% Fixed Income Portfolio rose 1.3% during the quarter, outperforming the global fixed income benchmark which gained 0.6%. The Portfolio benefitted from its overweight to credit, which saw good performance during the quarter as credit spreads tightened. Within the Portfolio, the Dimensional Global Core Fixed Income Fund was the best performer, gaining 1.3% during the quarter due to its larger credit exposure. On the other hand, the Dimensional Global Short Fixed Income Fund was the weakest performer, rising by 1.0% as it has the lowest credit exposure amongst the three Dimensional Fixed Income funds.
Endowus Satellite Portfolios
Launched in November 2021, the Endowus Satellite Portfolios are designed to supplement the core portfolios and offer clients specific exposure to opportunities in selected regions, themes, asset classes, and trends.
In taking a core-satellite approach, most investors should allocate the bulk of their asset allocation to the core portfolios.
China Equity Portfolio
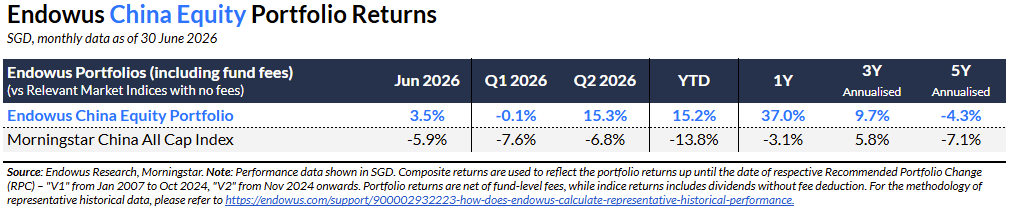
Key performance highlights:
The China Equity model portfolio posted a 15.3% gain in Q2 2026, extending its substantial outperformance against the Morningstar China All Cap Index across Q1, Q2, and the year-to-date. This sustained lead was primarily driven by our structural tilt toward onshore A-shares and a strategic underweight to the benchmark-heavy offshore mega-caps. The T. Rowe Price China Evolution Fund remained the portfolio’s top-performing constituent, delivering a standout 30.7% return.
The global macroeconomic environment was defined by acute geopolitical volatility. Escalating US-China trade tensions and the early-March closure of the Strait of Hormuz triggered a severe global energy shock. This sparked a "risk-off" flight to safety, draining capital from emerging markets and reigniting global inflation fears.
Domestically, China’s economic recovery remained sluggish and unbalanced:
- Growth slowed: Q2 GDP growth decelerated to 4.3% year-over-year, missing market forecasts and falling short of Q1’s 5.0% expansion.
- Property and consumer drag: The protracted property sector downturn continues to erode household wealth and dampen consumer confidence. This was starkly evident in May retail sales, which contracted year-over-year for the first time since the pandemic.
- Export resilience: Conversely, manufacturing and exports acted as the primary growth engines. June exports surged 27%, driven by global demand for AI-related technology components and frontloading by US retailers anticipating tariff hikes. However, this heavy reliance on external demand leaves the broader economy vulnerable to ongoing trade frictions.
This turbulent backdrop created a sharp divergence across both geography and market capitalization, perfectly aligning with the portfolio’s strategic positioning.
- Onshore vs. Offshore: The March risk-off shock hit offshore-listed equities (H-shares and ADRs) the hardest, as they are highly sensitive to foreign portfolio flows and swing violently with global risk sentiment. Onshore A-shares proved much more resilient, remaining insulated from foreign capital flight and directly supported by domestic reflationary policies.
- Mid-Cap vs. Mega-Cap: This divergence extended down the market-cap spectrum. The widely held, offshore platform and technology giants that dominate the Morningstar index took the hardest hit of global risk aversion. In contrast, the portfolio’s underlying funds—such as the T. Rowe Price China Evolution Equity Fund—target "rising stars" beyond the top 100 mega-caps. This strategic focus on dynamic, domestically oriented mid- and small-cap companies provided a significant performance advantage over the quarter.
Megatrends Portfolio

Key performance highlights:
The Megatrends portfolio performed largely in line with the benchmark in the second quarter of 2026. The months of April and May were characterised by a strong rebound from the drawdown in March, and accounted for the bulk of the quarter’s returns. There was a significant dispersion in performances of single-theme funds, with biotechnology and AI & robotics outperforming, while agribusiness and climate change detracted.
The technology sector performed strongly in April and May, driven by the AI-related trade. The Thematics AI and Robotics Fund was a major beneficiary and produced one of its strongest quarterly returns at around +32%. The biotechnology sector was an initial laggard, but a very robust return in June ensured a strong finish to the quarter. In particular, positive regulatory developments, a surge in dealmaking, and strong capital inflows contributed to the sector and the Janus Henderson Biotechnology Fund generating positive, double-digit returns in June alone.
For agribusiness, after a very strong performance in the first quarter, returns flipped in the second quarter, with the DWS Global Agribusiness declining by 6%. Fertiliser producers were under pressure, as the combination of high input costs and lower commodity prices led to margin compressions. For the GMO Climate Change Fund, a proposed repeal of the entire US SEC’s 2024 climate-related disclosure rules in June was a headwind, while the segment was also a victim of a rotation into value and smaller stocks.
Technology Portfolio
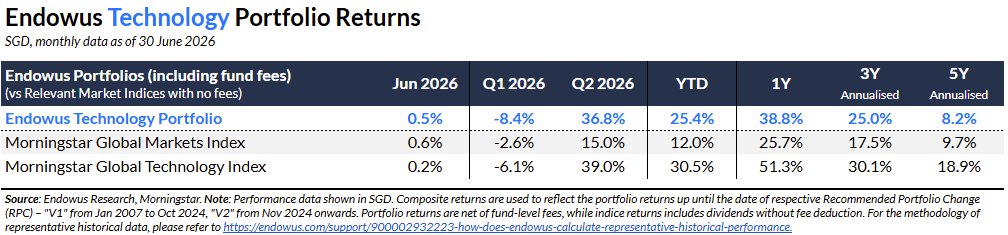
The Technology Portfolio rose 36.8% in Q2 of 2026. This compares to the Morningstar Global Markets Index which rose 15.0% and the Morningstar Global Technology Index which rose 39.0% during the same period.
While 5 of the 6 underlying tech funds outperformed the Global Tech Index, the Fidelity Global Technology Fund (+18%) which has the largest weight (30%) in the portfolio had a noticeable underperformance in Q2 which impacted the relative performance of the overall portfolio. The Fidelity Tech fund has historically shown strong risk adjusted performance given its relatively low volatility and strong valuation discipline. However, in Q2, the relative performance was primarily impacted by the absence of exposure to high flying semiconductor names such as Micron Technology and SK Hynix. The manager remains cautious on the sustainability of the current AI-driven capital expenditure cycle.
The BGF Next Generation Technology Fund (+59%) and the BGF World Technology Fund (+55%) were the best performers thanks to the underweight to software, stock selection, and performance of the semiconductor sector. The Janus Henderson Horizon Global Tech Fund (+43%), JPM US Technology Fund (+42%), and Franklin Technology Fund (+42%) also benefited from the strength of the semiconductor sector and outperformed the sector index. We believe the different views and styles of the managers provides good diversification for the portfolio.
Endowus Real Assets Portfolio
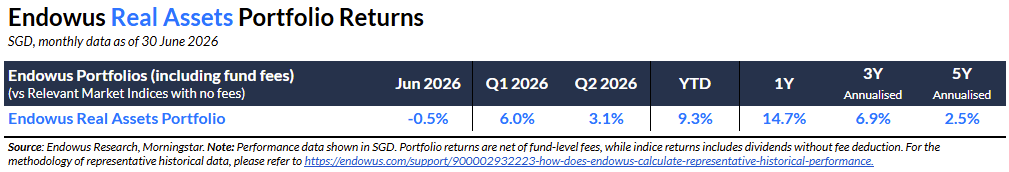
Key performance highlights:
The Endowus Real Assets portfolio eked out a slight positive return in the second quarter, as there was another large dispersion in returns between the different underlying asset classes. Most of the underlying funds participated in April’s relief rally, but May represented a pullback while June’s returns were dragged down by losses in the natural resources segment.
The real estate/property funds were the strongest performers and generated the bulk of the portfolio’s positive returns, followed by a small contribution from the infrastructure funds. On the other hand, the two natural resources funds experienced a sharp drawdown in June, as oil prices started to normalise on the back of the US-Iran agreement, which contributed to losses in the energy segment. A sharp decline in the prices of precious metals such as gold and silver further added to the decline.
Endowus Income Portfolios
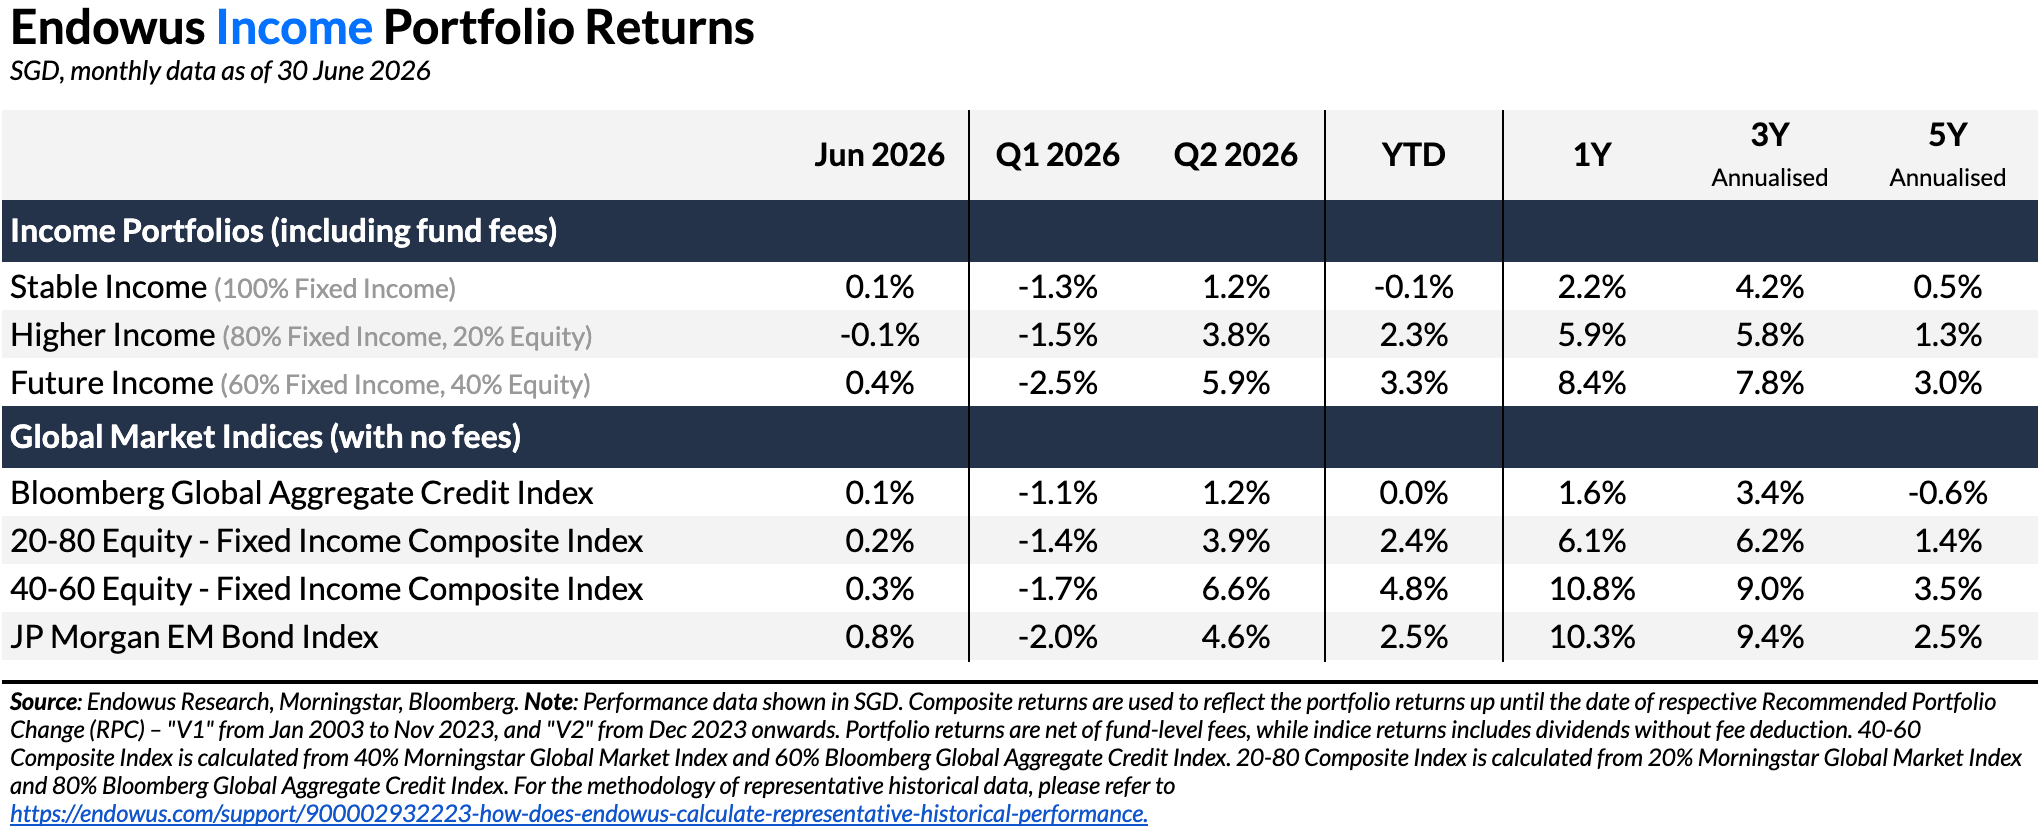
Key performance highlights:
The Stable Income Portfolio gained 1.2% in Q2 2026 and 0.1% in June, in line with the broader credit market. Overall, in the second quarter, risk sentiment turned positive and provided tailwinds for credit exposure. However, treasury yields edged up with curve flattening in the quarter, a negative for duration exposure. All of the underlying funds delivered positive returns, and the leader of the pact was Neuberger Berman Short Duration Emerging Markets Debt Fund (+1.9%), while the Asian bonds exposure via Fidelity Asian Bond Fund was a laggard.
The Higher Income Portfolio delivered 3.8% in Q2, slightly behind the 20-80 benchmark. June was a weaker month (-0.1%) compared to April and May, primarily due to weaker performance in the equities sleeve. Overall in the second quarter, the fixed income sleeve outperformed the broader credit market due to its tilt towards Emerging Markets and high yield. The equities sleeve slightly underperformed the broader equity market. The second quarter rally in the equities market was again driven by a return of optimism in AI, driving Growth and small cap stocks’ outperformance against Value. This was a headwind to the equities sleeve.
The Future Income Portfolio gained 5.9% in Q2 2026, underperforming the 40-60 benchmark. The fixed income sleeve performed in line with the broader credit market due to the same factors affecting the Stable Income Portfolio. The equity component lagged the broader equities market in Q2, primarily driven by the underperformance of the AB Low Volatility Equity Portfolio, as the market continued to reward more volatile, growth-oriented stocks.
Latest portfolio update:
In September 2025, we revised the target payout of the Higher Income Portfolio downwards to 5–6%. The increase in hedging costs between the SGD and USD has caused certain fund managers to lower their payouts, impacting overall payout levels across all three Income Portfolios. This in particular caused the Higher Income Portfolio's payout yield to dip below its prior target range. In light of the prevailing interest rate cycle, we believe it is prudent to maintain this lower target payout range.
Investment-grade flexible income funds continue to generate income comparable to high-yield funds in the current environment, where high-yield credit spreads remain particularly tight. As a result, the Higher Income Portfolio's payout yield is currently similar to that of Stable Income. However, it is important to note that the Higher Income Portfolio has delivered stronger growth in total return than Stable Income, thanks to its prudent addition of credit and equity risk. This means that after receiving income distributions, investors in the Higher Income Portfolio have seen a stronger increase in their invested capital.
In line with our commitment to continuously improve the portfolios, we have made targeted fund selection upgrades to the Higher Income Portfolio in June 2026. These changes replace a number of funds with higher-quality alternatives that we believe will deliver better risk-adjusted total returns over time, while maintaining the same target payout of 5–6% per annum and the same overall asset allocation (80% fixed income, 20% equities). For more detailed information on the portfolio change, please refer to this article. Portfolio statistics from July 2026 onwards for Higher Income Portfolio will reflect the latest allocation post recommended portfolio changes.

Endowus Cash Smart Portfolios
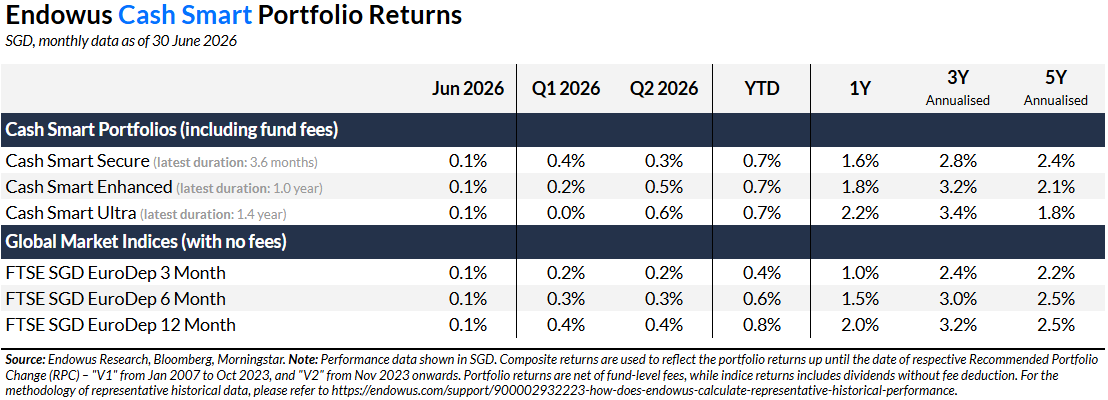
Key performance highlights:
The Cash Smart portfolios delivered positive returns in Q2 2026.
The second quarter of 2026 saw a continued sell-off in US rates through June, as the market priced in concerns that inflation would stay elevated. The 2-year US Treasury yield jumped 38bps over the quarter to 4.17%, while the 10-year yield climbed 14bps to 4.46%, as markets re-assessed policy expectations and started to price in 1-2 rate hikes by year end. The Fed kept the federal funds rate firmly on hold at 3.5%–3.75% at its June meeting, pointing to elevated inflation and energy shocks. Despite rising US rates, both IG and HY credit spreads tightened as the markets showed signs of recovery in Q2, supported by progress in US/Iran negotiations and a memorandum of understanding signed in mid June.
On the other hand, SG rates fell across the curve beyond the 6-month tenor. The MAS tightened its policy modestly in April, slightly increasing the slope of appreciation for the S$NEER policy band, as it raised its full-year 2026 headline and core inflation forecasts to 1.5%–2.5% on the back of rising fuel and commodity prices. Cash Smart portfolios, with a very low duration profile and low rate sensitivity, remained resilient and provided steady returns during this period.
Cash Smart Secure closed the second quarter of 2026 up 0.3%. This performance was supported by consistent monthly returns throughout the April to June period. The two underlying funds in the portfolio, Fullerton SGD Cash Fund and LionGlobal SGD Enhanced Liquidity Fund, delivered steady returns during the quarter through its portfolio of cash deposits and money market securities, though falling SG rates reduced the portfolio yield slightly. Secure remains a relatively safer option across the Cash Smart suite for investors seeking shelter for their investments while generating short-term yield.
Cash Smart Enhanced generated a positive return of 0.5% in the second quarter of 2026. The UOB United SGD Fund delivered the strongest performance in the portfolio, with its portfolio of short-duration bonds experiencing a tailwind from falling SG rates. The other two cash/money market funds delivered steady, positive returns, less impacted by falling SG rates due to their ultra-low duration. With a slightly added risk, the Enhanced portfolio takes on slightly more credit risk than Secure with its higher exposure to short duration bonds.
Cash Smart Ultra generated a positive return of 0.6% during the second quarter of 2026. Short duration bond funds generally outperformed money market and cash vehicle funds. The best performance came from PIMCO GIS Low Duration Income fund, whose higher carry and holdings in agency MBS and corporate bonds proved resilient and benefited from credit spread tightening during the quarter. Other underlying funds delivered positive, steady returns over the 3-month period. With a higher added risk than Enhanced or Secure, Ultra has a potential to produce higher returns. Investors seeking to largely avoid exposure to market volatility may consider switching to lower-risk portfolios such as Secure or Enhanced.

Cash Smart Portfolios, primarily exposed to USD and SGD market rates, has seen relatively rangebound yields over the last 3 months. Given the varying levels of duration and credit risk across the portfolios, investors are encouraged to review their investment goals and assess whether their current Cash Smart Portfolio remains aligned with their needs.
Endowus Q1 & March 2025 Portfolio Performance Review

Endowus Q3 2024 Performance Review

Endowus Q2 2024 Performance Review
.jpg)


%20F1(2).webp)

.webp)


.webp)