

.webp)
.webp)
.webp)
.webp)


.webp)


%20(1).gif)

Register for the event
Endowus invites you to our exclusive event with Macquarie Asset Management, as we discuss unlocking opportunities in Infrastructure- a $1.3tn asset class.
This event is reserved for Accredited Investors (AIs) only. To register for the event, please indicate one of the following:
In the first quarter of 2026, markets were reshaped by a confluence of forces that few had anticipated at the turn of the year: an escalating geopolitical conflict in the Middle East, a dramatic energy price shock, renewed inflation concerns, and a consequent reassessment of central bank policy paths globally.
What began as a continuation of the broad rotation away from US mega-cap technology that started in late 2025 became increasingly dominated by the macroeconomic implications of the US-Iran conflict. The quarter ended with risk assets broadly in the red, but meaningful pockets of outperformance in energy, defensive equity, and select non-US markets that validated the importance of diversification.
Macro backdrop
The defining macro event of the quarter was the escalation of the conflict between the United States, Israel, and Iran.
On 28 February 2026, coordinated airstrikes targeted Iranian military and nuclear facilities. Iran retaliated with missile and drone attacks on regional US military bases and, most consequentially for markets, disrupted shipping through the Strait of Hormuz, a critical artery through which roughly 20% of global oil supply passes. Estimates suggest flows through the Strait declined by as much as 95% at the height of the disruption. The human and economic consequences of this conflict proved to be the single most significant driver of cross-asset performance in Q1 2026.
The Strait of Hormuz disruption pushed oil prices to near-record levels, with US crude rising more than 50% from the start of the conflict, approaching and testing the $110/bbl level by quarter-end. These elevated energy prices transmitted almost immediately into inflation data, with the OECD revising its inflation forecast for the G20 upward by 1.2 percentage points to 4.0%.
Global equities ended the quarter down 2.9% on a USD basis after being up 4.9% until February while global bonds also erased all of its YTD gains in March.
Gold had a volatile but overall constructive quarter. After extending its extraordinary 2025 rally—gaining roughly 25% in January to briefly trade above $5,300 per troy ounce—gold suffered a sharp correction at the end of January, and then again in March as the surging US dollar following the Iran conflict escalation triggered de-risking even from Gold. The US dollar index (DXY) also had a volatile quarter, weakening notably against major currencies through January and early February as rate cut expectations built, only to reverse sharply as the Iran conflict drove safe-haven demand. The DXY settled near 100 by quarter-end.
Coming into 2026, the Federal Reserve had cut rates three times in the second half of 2025 (bringing the upper end of the Fed funds rate to 3.75%), and markets were pricing in further easing. Indeed, through the first two months of 2026, softer economic data continued to make the case for additional cuts, and bond markets rallied in anticipation. The Iran war abruptly reversed this narrative. The energy-driven inflation shock made it untenable for the Fed to ease further, and by quarter-end bond traders were beginning to price in the possibility of a rate hike rather than further cuts.
Global equity markets
Q1 2026 was, for most equity markets, a difficult quarter, particularly in the second half of the period.
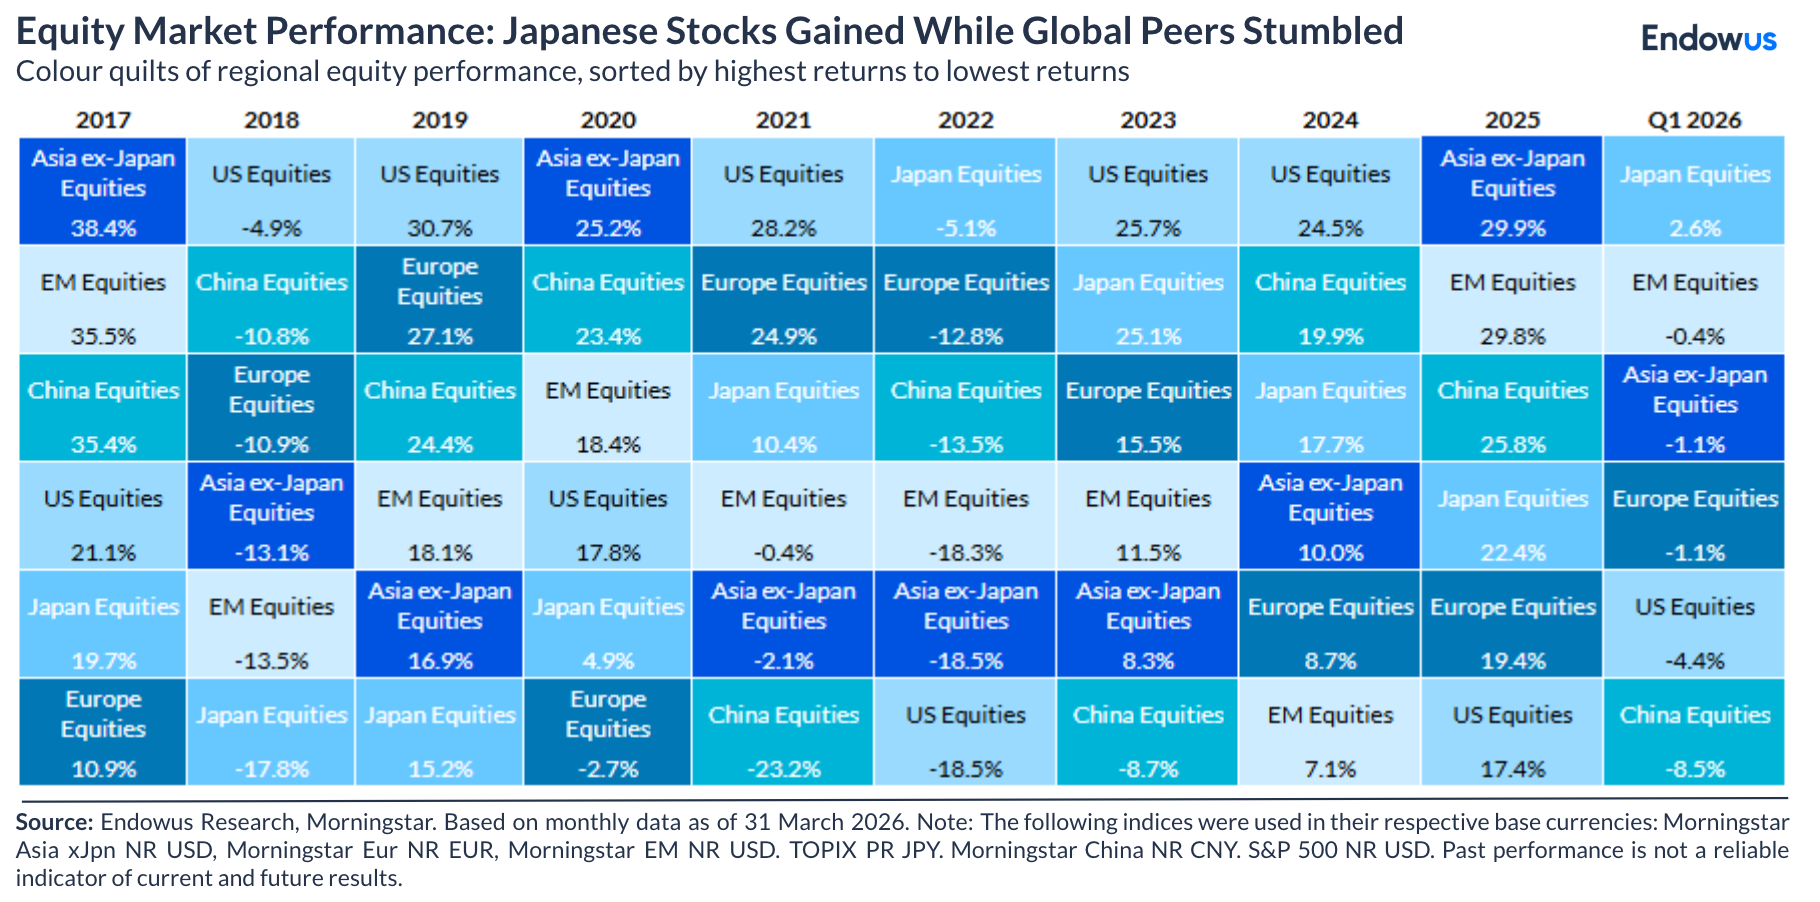
The S&P 500 fell approximately 4.4% over the quarter, rising 1.4% in January before declining 0.8% in February and a more pronounced 5.0% in March as the conflict escalated. The Nasdaq Composite fared worse, falling close to 6% as the rotation away from mega-cap technology accelerated. Developed markets ex-US outperformed US markets in 1Q continuing a trend that began in earnings in 2025. Emerging markets presented a mixed picture in 1Q following their exceptional performance in 2025.
The most significant development within US equities was the continued and decisive rotation away from the mega-cap technology names that had led markets since 2022. All seven members of the so-called "Magnificent 7" declined in Q1, collectively accounting for nearly 90% of the S&P 500's quarterly loss.
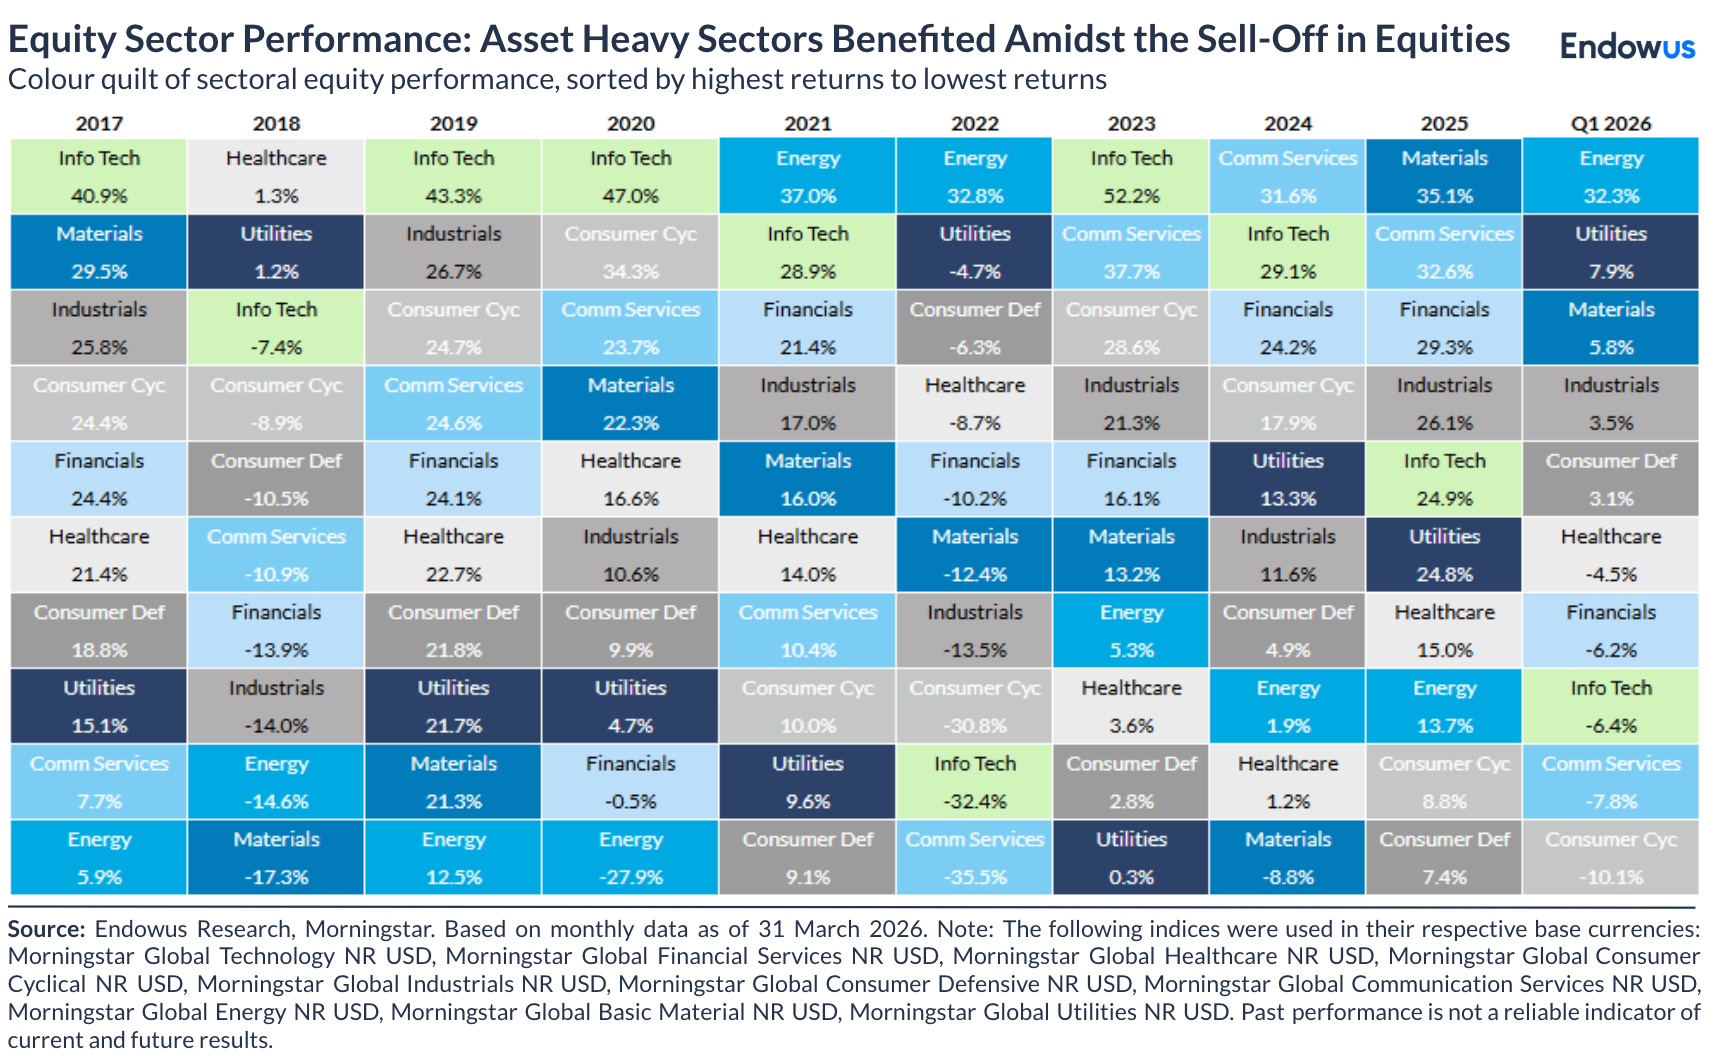
The flip side of this dynamic was meaningful outperformance in value, small- and mid-cap, and defensive sectors. Mid-cap stocks and small-caps actually posted positive returns for the quarter. Also Russell 1000 Value significantly outperformed Russell 1000 Growth. Energy was the standout sector by a wide margin, rising 32% as the oil price surge translated directly into earnings upgrades for producers and infrastructure companies. Utilities gained 8%, Materials rose 6%, and Consumer Staples added 3% as investors sought defensive income amid geopolitical uncertainty.
European equities showed relative resilience, supported by fiscal expansion in defence spending and infrastructure investment, improving household spending, and continued ECB easing earlier in the cycle. The prospect of a weaker US dollar, which materialised particularly in January and early February, provided an additional tailwind for non-US assets in USD terms, though the dollar subsequently strengthened as the conflict pushed safe-haven flows into Treasuries and the greenback.
Japan remained an important source of opportunity for global investors. Continued expectations for positive fiscal expansion under the government boosted equities, with inflows into Japanese stocks remaining elevated despite domestic political uncertainty around elections and ongoing BoJ policy debate. However, a notable rise in JGB yields in January rippled through global fixed income markets, a reminder of Japan's systemic importance in global rates.
Emerging markets entered the quarter with strong momentum and attractive valuations, with forward P/E ratios around 14x versus the S&P 500's 22x at the start of the year. However, the energy shock and dollar strength weighed on EM assets during the second half of the quarter, particularly EM debt. EM equities nonetheless showed relative resilience compared to their full-year 2025 trajectory.
Country divergence was significant. India, after a strong multi-year run, continued to see foreign investors take profits, with foreign ownership of Indian equities at 15-year lows; however, the structural growth story remains intact and dips may prove opportunistic for patient investors. China continued its transition to advanced manufacturing, with credit flowing into semiconductors, robotics, and biotech. Korean and Taiwanese markets—tightly linked to the global semiconductor supply chain and the AI hardware buildout—continued to benefit from hyperscaler AI capital expenditure. Latin American markets, benefiting from attractive valuations and commodity exposure, showed continued relative strength.
Global fixed income markets
The fixed income story of Q1 2026 was one of two distinct halves, dramatically interrupted by the onset of the Iran conflict. Through January and into mid-February, softer economic data and expectations of Fed cuts drove rallies in Treasuries, with the 10-year US Treasury yield falling to as low as 3.97%—its lowest level since September 2024. The Morningstar US Core Bond Index gained nearly 2% in the first two months of the year.
Then, almost instantaneously, the war changed everything. Rather than acting as a safe haven (as it typically does during geopolitical stress), the 10-year Treasury sold off sharply as investors priced in the inflation consequences of the oil shock, with the 10-year yield climbing to approximately 4.88% by end-March — its highest level since mid-2025.
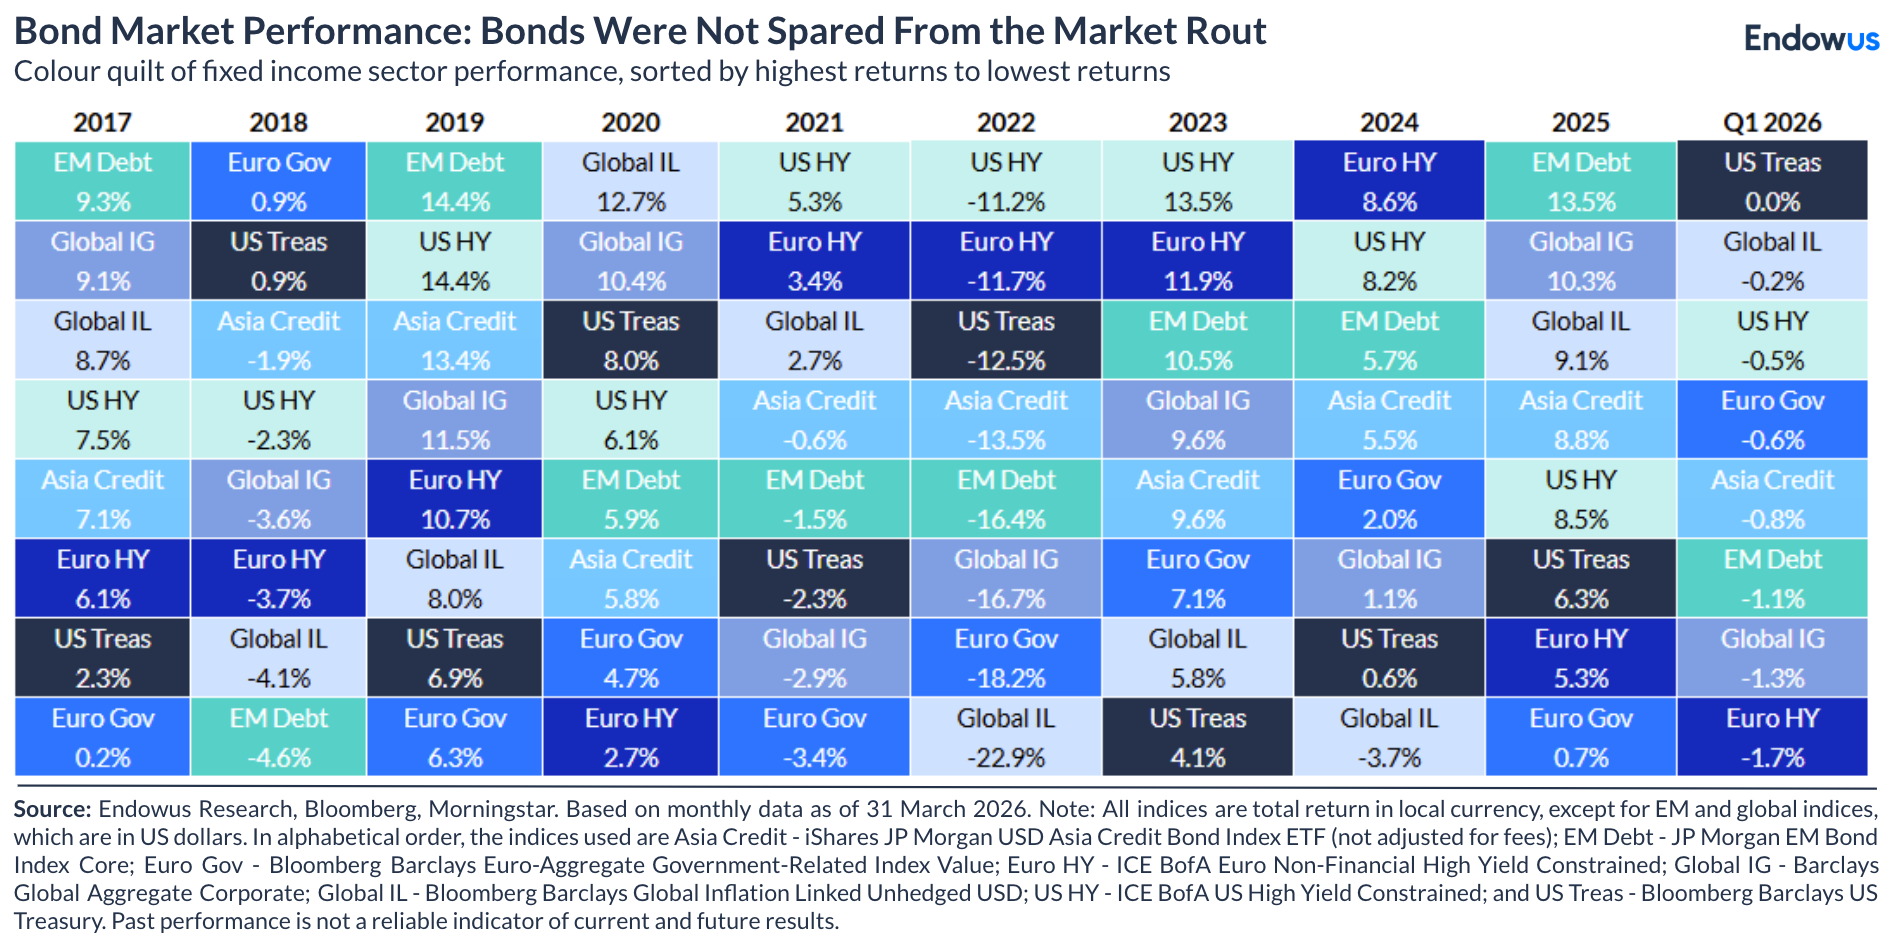
Corporate bonds underperformed Treasuries for the quarter as credit spreads widened in response to the deteriorating growth and inflation outlook. Investment-grade corporates fell approximately 1.3% for the quarter, underperforming the near-flat Treasury index. High yield spreads, which had been trading at historically tight levels (near 2.7% versus the long-run average of 4.9%) entering the year, widened as investor risk appetite contracted and concerns about leveraged borrowers and energy-exposed issuers mounted.
Securitised credit, including agency MBS, CLOs, and ABS, outperformed corporate credit during the quarter. Strong fundamentals, stable demand, and a smaller starting yield gap to Treasuries helped insulate this sector from the worst of the credit spread widening. Floating-rate structures like CLOs proved particularly resilient as the prospect of rates staying higher for longer actually supported coupon income.
After being a consistent outperformer throughout 2025, EM debt was the weakest sub-asset class in fixed income during Q1 2026. The twin headwinds of a stronger US dollar and rising global risk aversion—both driven by the Iran conflict—weighed heavily.
Short-duration Treasury Inflation-Protected Securities (TIPS) were among the better performers in fixed income, gaining around 0.84–0.97% for the quarter. Rising near-term inflation expectations driven by energy prices, combined with the low duration profile of short-term TIPS, provided a constructive backdrop for inflation-linked bonds. This was in sharp contrast to longer-duration fixed income, where the rate rise dominated returns.
With digital wealth platform Endowus, you can plan and manage your money—whether held in cash, CPF, or SRS—by investing in globally diversified, intelligent, low-cost portfolios seamlessly. To get started, click here.
Note: Figures in this article are based on Morningstar and Bloomberg data.
Webinar: Travel, market and crypto bubbles
.png)
We are heading into bubble trouble

Endowus 2020 review and 2021 outlook


%20F1(2).webp)

.webp)


.webp)