

.webp)
.webp)
.webp)
.webp)


.webp)


%20(1).gif)

Register for the event
Endowus invites you to our exclusive event with Macquarie Asset Management, as we discuss unlocking opportunities in Infrastructure- a $1.3tn asset class.
This event is reserved for Accredited Investors (AIs) only. To register for the event, please indicate one of the following:
- Most major equity indexes currently—including the S&P 500 and MSCI World—use a free-float, market-capitalisation-weighted methodology, which assigns weights based on the total value of each stock’s publicly available shares.
- Price-weighted indexes such as the Dow Jones Industrial Average are not considered to be reliable benchmarks as higher-priced stocks—regardless of company size—have an outsized impact on the index risk and return.
- Understanding index construction methodology matters for investors looking to get exposure to a specific benchmark, because the same set of stocks can produce meaningfully different risk and return profiles depending on how they are weighted.
Equity indexes combine exposure to a basket of stocks, each with its own weight. However, index providers can select different methodologies, each one having a direct impact on the weights that a single stock is assigned.
Two indexes tracking the same market may deliver different returns, carry different sector tilts, and respond differently to market events — simply because of how they weigh their constituents. For investors choosing between exchange-traded funds (ETFs) or index funds, understanding the benchmark index construction is key.
This article explains the major equity index methodologies in use today — free-float market-capitalisation weighting, full market-cap weighting, price weighting, equal weighting, factor-based approaches, and fundamental weighting — and draws out the portfolio implications for each.
Why is free-float market-capitalisation weighting the global standard?
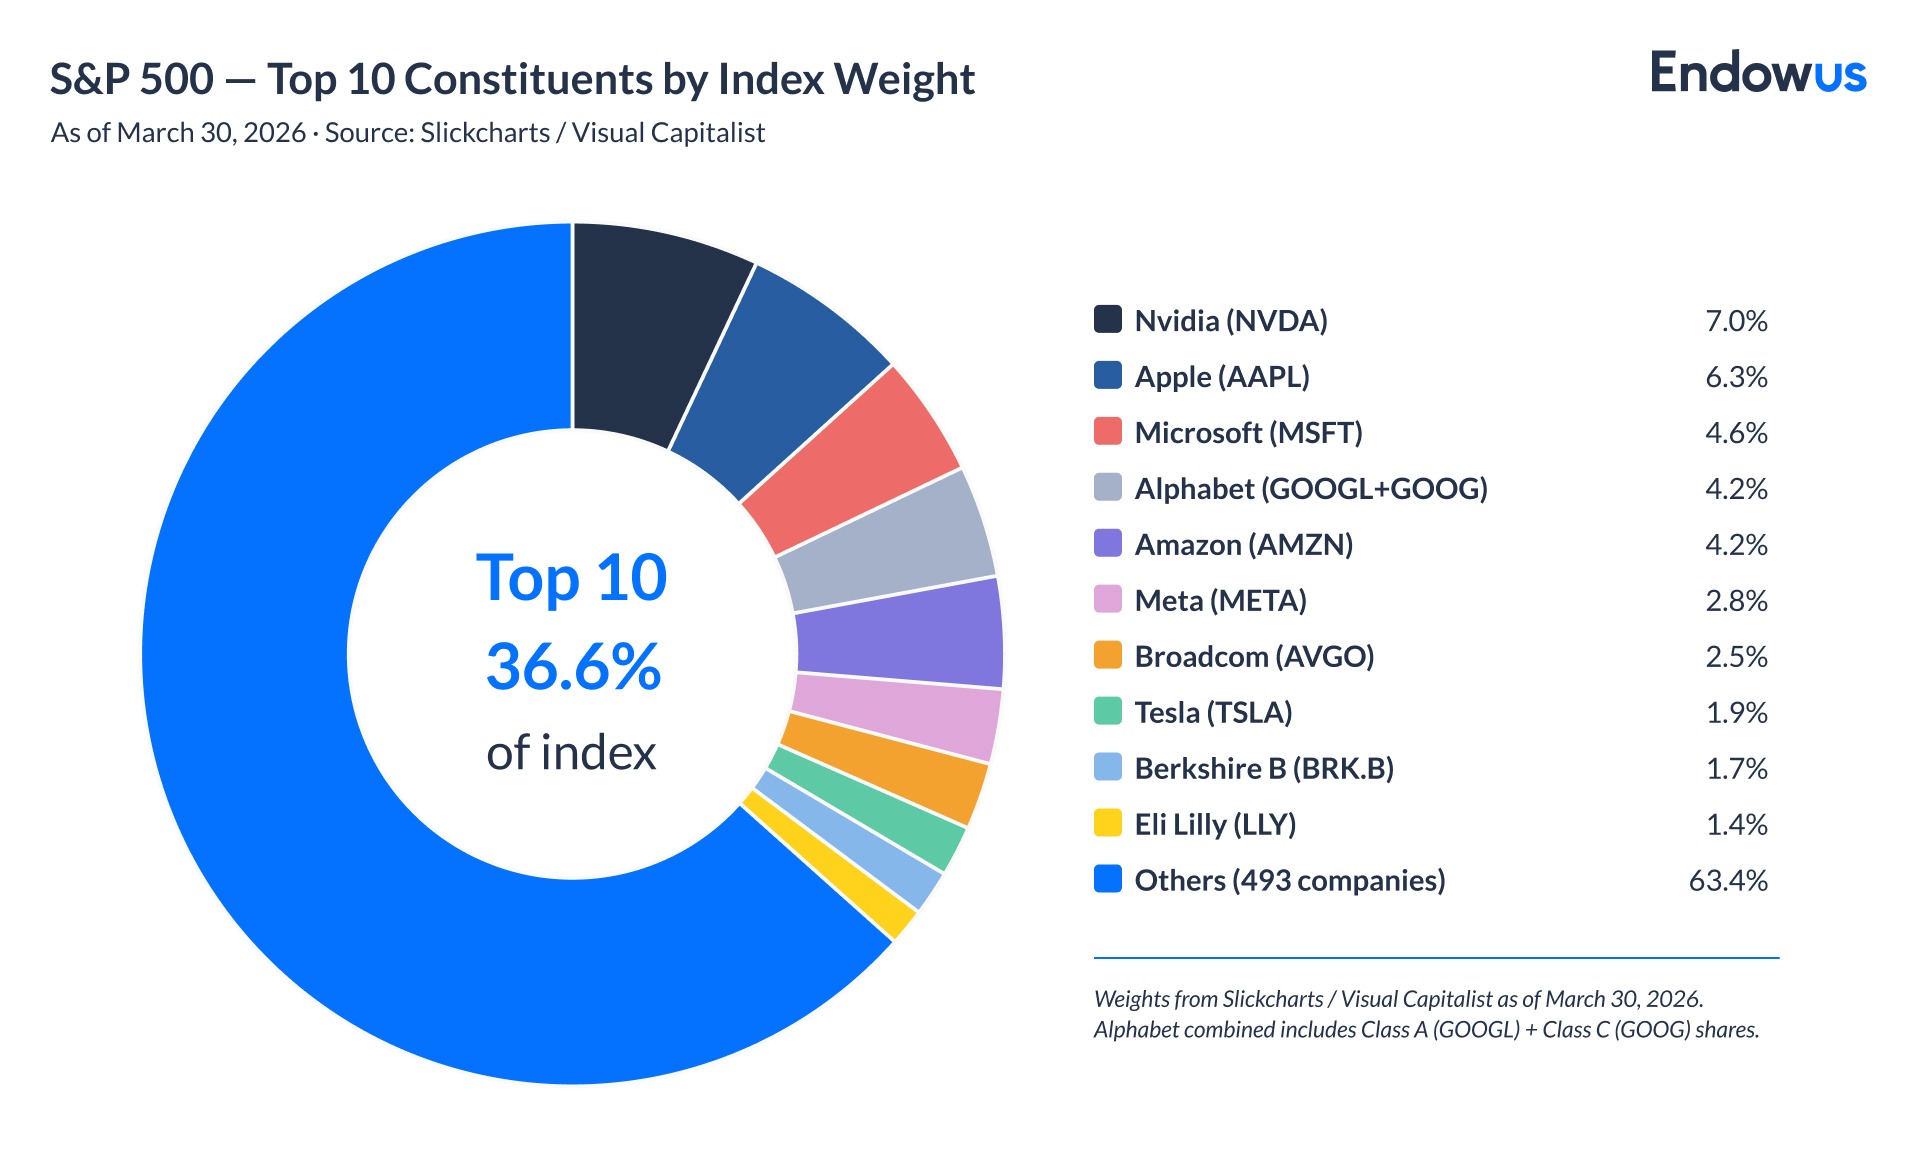
The most widely used methodology today is free-float market-capitalisation weighting. Under this approach, each index constituent is weighted by its market capitalisation — share price multiplied by the number of freely tradable shares outstanding.
“Freely tradable” is key, as shares held by governments, founding families, or other strategic shareholders — not available for public trading — are excluded from the calculation. This 'free float' adjustment ensures the index reflects a truly investable universe — the portion of the market that a fund manager can actually buy.
The S&P 500, MSCI World, FTSE 100, and most MSCI and FTSE Russell benchmarks all use this methodology. Because larger companies receive a larger weight, the index naturally concentrates in the biggest names. As of early 2026, the top 10 constituents of the S&P 500 accounted for roughly 36.6% of the index by weight — a feature critics describe as large-cap bias, but one that proponents argue simply reflects where the most investable capital sits.
What is the difference between full market capitalisation and free-float weighted market capitalisation?
Before free-float adjustment became standard in the early 2000s, many indexes used full market capitalisation — counting all shares outstanding, including non-tradeable ones. This gave larger weights to companies where strategic blocks of shares were locked up.
MSCI made the transition to free-float methodology in 2001 and 2002, and most major index providers followed. Full market-cap weighting is now rarely seen in new index construction, though some legacy benchmarks may retain it. The practical difference matters most in markets with significant state ownership or concentrated family-controlled shareholdings — common across parts of Asia and emerging markets.
What are price-weighted indexes and why are they not suitable for present times?
Price-weighted indexes weight each constituent by its share price alone, with no reference to company size. A stock trading at US$400 per share has exactly twice the index influence of one trading at US$200, regardless of whether the first company is larger, more profitable, or more economically significant.
The Dow Jones Industrial Average (DJIA) — which used to be the world's most quoted equity benchmark — uses price weighting. So does Japan's Nikkei 225. The method dates to an era before computing power made capitalisation calculations routine: Charles Dow's original 1896 index simply averaged the prices of its constituents.
The structural quirk creates genuine distortions. When UnitedHealth Group, one of the highest-priced DJIA components, fell sharply in late 2024, its impact on the index was disproportionate to its economic weight. Conversely, a stock split — which lowers a share's price without changing the company's value — mechanically reduces that company's index weight.
Price-weighted indexes are widely reported but widely criticised by portfolio professionals. They remain in use largely because of their brand recognition despite their lack of analytical rigour.
What are equal-weighted indexes and why are they still relevant?
Equal-weighted indexes assign the same weight to every constituent, regardless of size or price. If an index has 500 members, each receives a 0.2% weight at each rebalancing date.
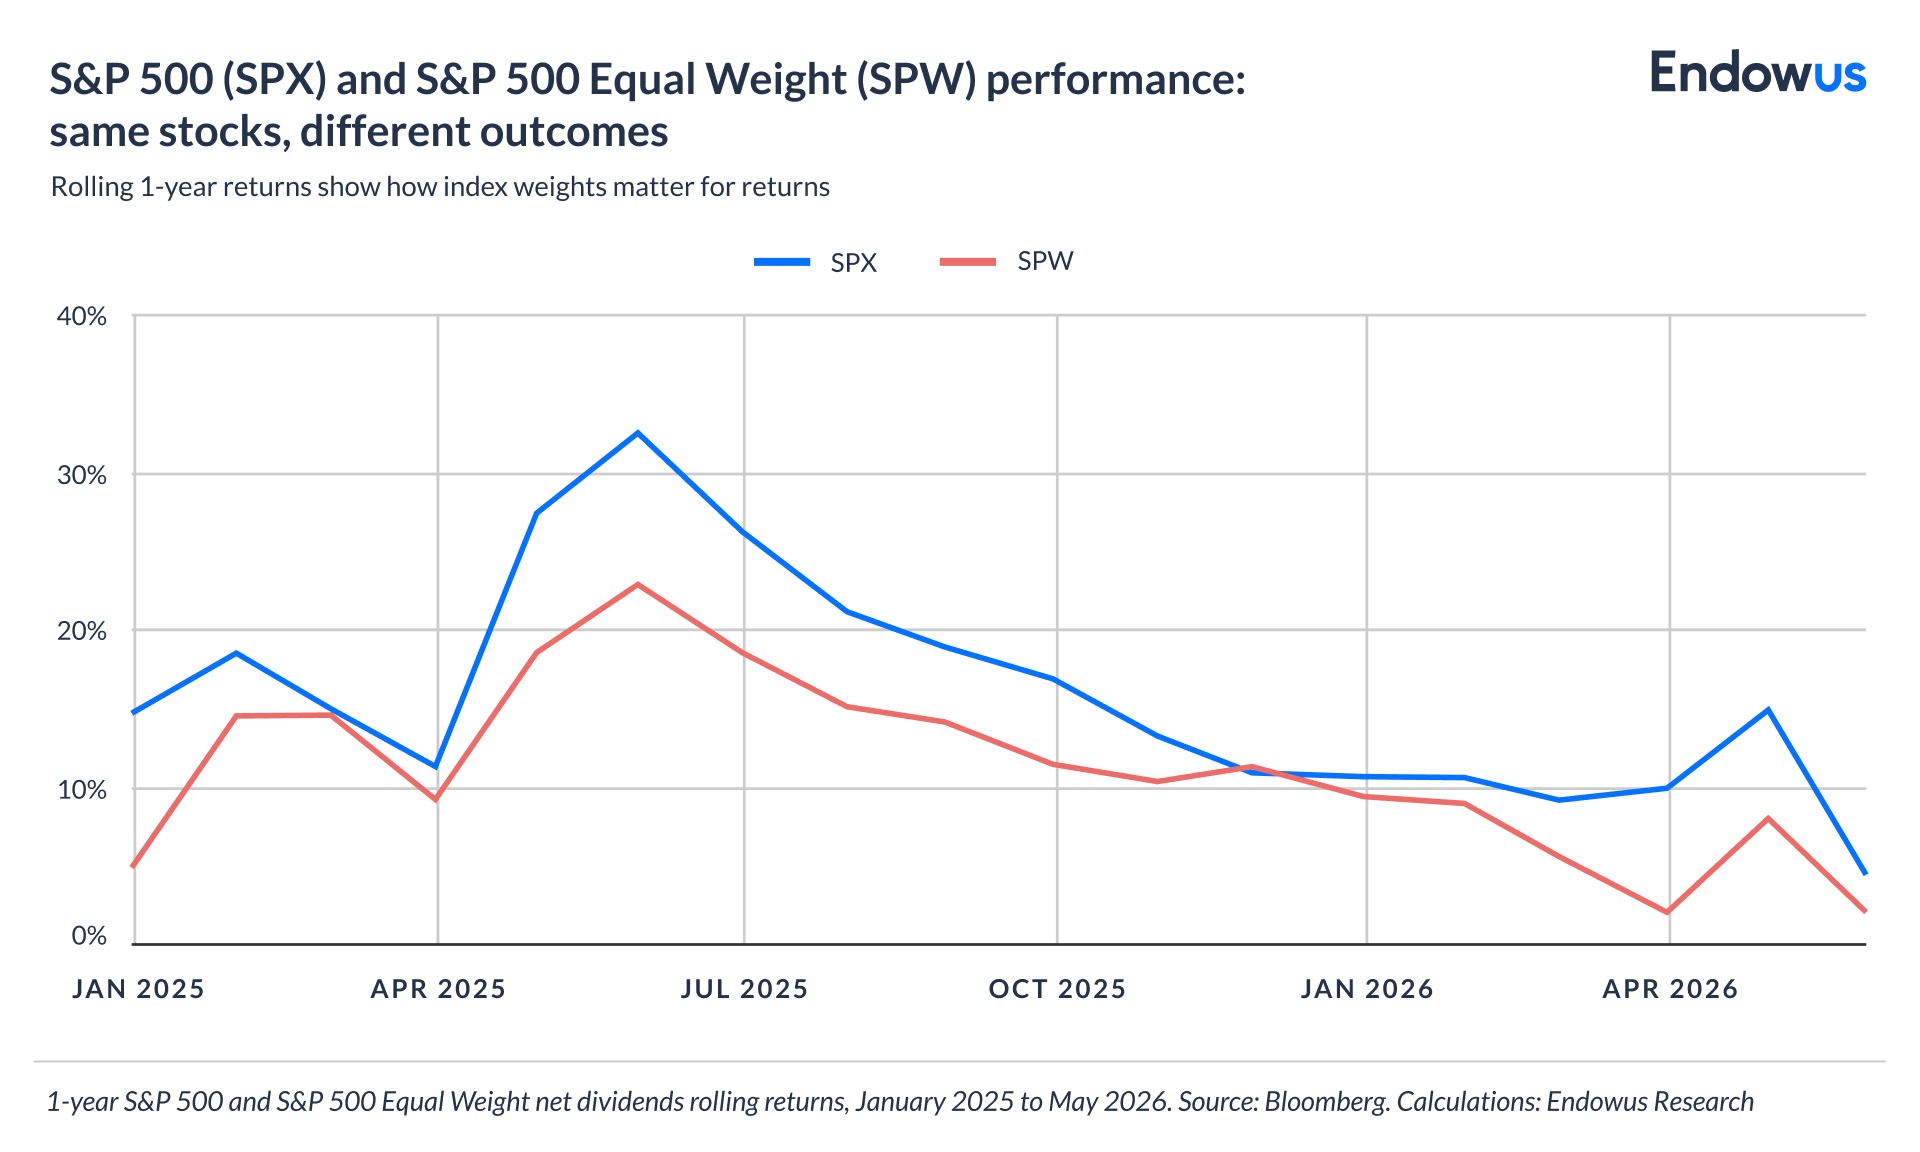
The S&P 500 Equal Weight Index (EWI) is the best-known example. Compared to its cap-weighted sibling, equal weighting produces a meaningful small- and mid-cap tilt — smaller companies, which would otherwise receive negligible weights, are brought up to parity with the giants. Historically, equal-weighted versions of the S&P 500 have outperformed the cap-weighted version over long periods, though the relationship is not consistent across all market cycles.
The advantage is additional diversification, while the cost is implementation complexity. Equal-weighted indexes require constant rebalancing: as prices move, weights drift away from equality, and periodic resets generate higher transaction costs and potential tax drag. For large funds, this turnover may erode the performance advantage that equal weighting theoretically offers.
What are factor-based, “smart beta” indexes and what are they key features?
Factor-based indexes — often marketed as 'smart beta' — apply a deliberate tilt toward one or more investment factors: value, quality, momentum, low volatility, or size. Rather than weighting by price or market cap, they weigh by a factor score derived from financial metrics.
MSCI's factor index suite is among the most widely followed. The MSCI Minimum Volatility Index, for instance, selects and weights stocks to produce the lowest-volatility portfolio possible within certain constraints. The MSCI Quality Index tilts toward companies with high return on equity, stable earnings, and low leverage.
These indexes have genuine theoretical grounding in decades of academic factor research. But they carry risks that standard cap-weighted indexes do not, such as higher turnover, sensitivity to factor timing (momentum strategies may underperform in mean-reverting markets), and concentration in sectors where a given factor naturally clusters. An investor holding a quality factor ETF should understand they are making an active bet on a factor, not simply “owning the market.”
What are fundamental-weighted indexes and why do they reflect economic reality?
Fundamental-weighted indexes weigh constituents by economic size rather than market prices. Common metrics include revenue, book value, dividends, and cash flow. The FTSE RAFI (Research Affiliates Fundamental Index) series pioneered this approach.
The rationale is straightforward: market-cap weighting overweights overvalued stocks and underweights undervalued ones, because prices embody market sentiment as well as fundamentals. Weighting by earnings or revenue, the argument goes, anchors the index to something more stable than short-term price movements.
In practice, fundamental weighting tends to produce a value tilt and often overweights sectors with high revenues relative to market cap — financials and energy, for instance. This has produced periods of strong outperformance and periods of underperformance relative to cap-weighted benchmarks. The approach is more complex to implement and requires clear rules around which fundamental metrics to use and how frequently to update them.
What are the key advantages and limitations of each method?
The table below summarises the key characteristics of each approach.
What does this mean for your portfolio?
Index methodology has a logical and intuitive impact on investor returns. When investors buy a benchmark-tracking product that follows the rebalancing of a specific index, the way the index is weighted influences the product’s return profile.
Investors with a specific view — that small caps may outperform over the next decade, or that high-quality companies deserve a premium allocation — may find equal-weighted or factor-based indexes a more appropriate benchmark than an active fund. The key is understanding precisely what tilt is being introduced and why.
Price-weighted indexes are most recently seen as flawed and not suitable to benchmark portfolios. Instead, price-weighted indexes such as the Nikkei 225 and DJIA are typically read as market mood indicators.
On the other hand, funds tracking the MSCI World or S&P 500 — free-float market-cap-weighted indexes — have been recognised by academics and practitioners alike as more suitable for benchmarking and passive investments.
Explore our Index Funds Collection
Endowus offers a curated list of funds that track various broad, diversified market indices, including the MSCI World Index, MSCI Emerging Markets, and S&P 500 Index.
We refund 100% of the distribution fees paid to us by fund managers to our clients, so that you can invest at the lowest cost possible
Frequently asked questions about equity indexes
What is the most common equity index methodology?
Free-float market-capitalisation weighting is the dominant methodology for major global benchmarks, including the S&P 500, MSCI World, and FTSE 100. It weights each stock by the value of its publicly tradeable shares.
Why does it matter which index methodology my ETF tracks?
The choice of benchmark produces different exposures depending on the benchmark’s weighing methodology. Cap-weighted indexes increase exposure to the largest companies; equal-weighted indexes tilt toward smaller firms; factor indexes introduce deliberate biases toward value, quality, or momentum. Choosing what benchmark a specific product is tracking is an investment decision in itself.
Is a price-weighted index like the Dow Jones a good benchmark?
The DJIA is widely quoted but is not regarded as an analytically rigorous benchmark by most professionals. Its price-weighting means the highest-priced stocks disproportionately influence returns, regardless of company size or economic weight. It is useful as a sentiment indicator but not as a portfolio construction tool.
What is free-float adjustment in market-cap weighted indexes, and why does it matter?
Free-float adjustment excludes shares held by strategic shareholders — governments, founders, or controlling families — that are not available for public trading. This ensures the index reflects what investors can actually buy, rather than the total issued shares of a company. It became standard practice for most major index providers in the early 2000s.
Are factor-based indexes 'active' or 'passive' investments?
Stock weights in factor, or smart-beta, indexes are based on specific factors — the MSCI Minimum Volatility Index, for instance, selects and weights stocks to produce the lowest-volatility portfolio possible within certain constraints. Investors who choose products tied to these indexes may have deliberate views about which characteristics drive returns.
Webinar: Investing in a better future: Through the lens of an equity investor

Why ESG investing should matter to Singaporeans

When you can’t see the forest for the trees: A holistic approach to asset allocation


%20F1(2).webp)

.webp)


.webp)