

.webp)
.webp)
.webp)
.webp)


.webp)


%20(1).gif)

Register for the event
Endowus invites you to our exclusive event with Macquarie Asset Management, as we discuss unlocking opportunities in Infrastructure- a $1.3tn asset class.
This event is reserved for Accredited Investors (AIs) only. To register for the event, please indicate one of the following:
The original version of this article first appeared in The Business Times.
The first week of March 2026 has rocked the markets and is currently testing investor nerves.
U.S. and Israeli strikes on Iran sent Brent crude surging above US$100 a barrel, shuttered Gulf airspace, and triggered circuit breakers from Seoul to Karachi. The world’s best performing stock market in Korea, suffered its worst single-day crash since 2008, Gold spiked, the VIX jumped to 30, and treasury yields whipsawed as investors struggled to decide whether to fear inflation or flee to safety.
It is human nature to feel that this time is different and worse. But the science of wealth demands we look beyond the headlines and examine the evidence.
History’s comfortable lesson
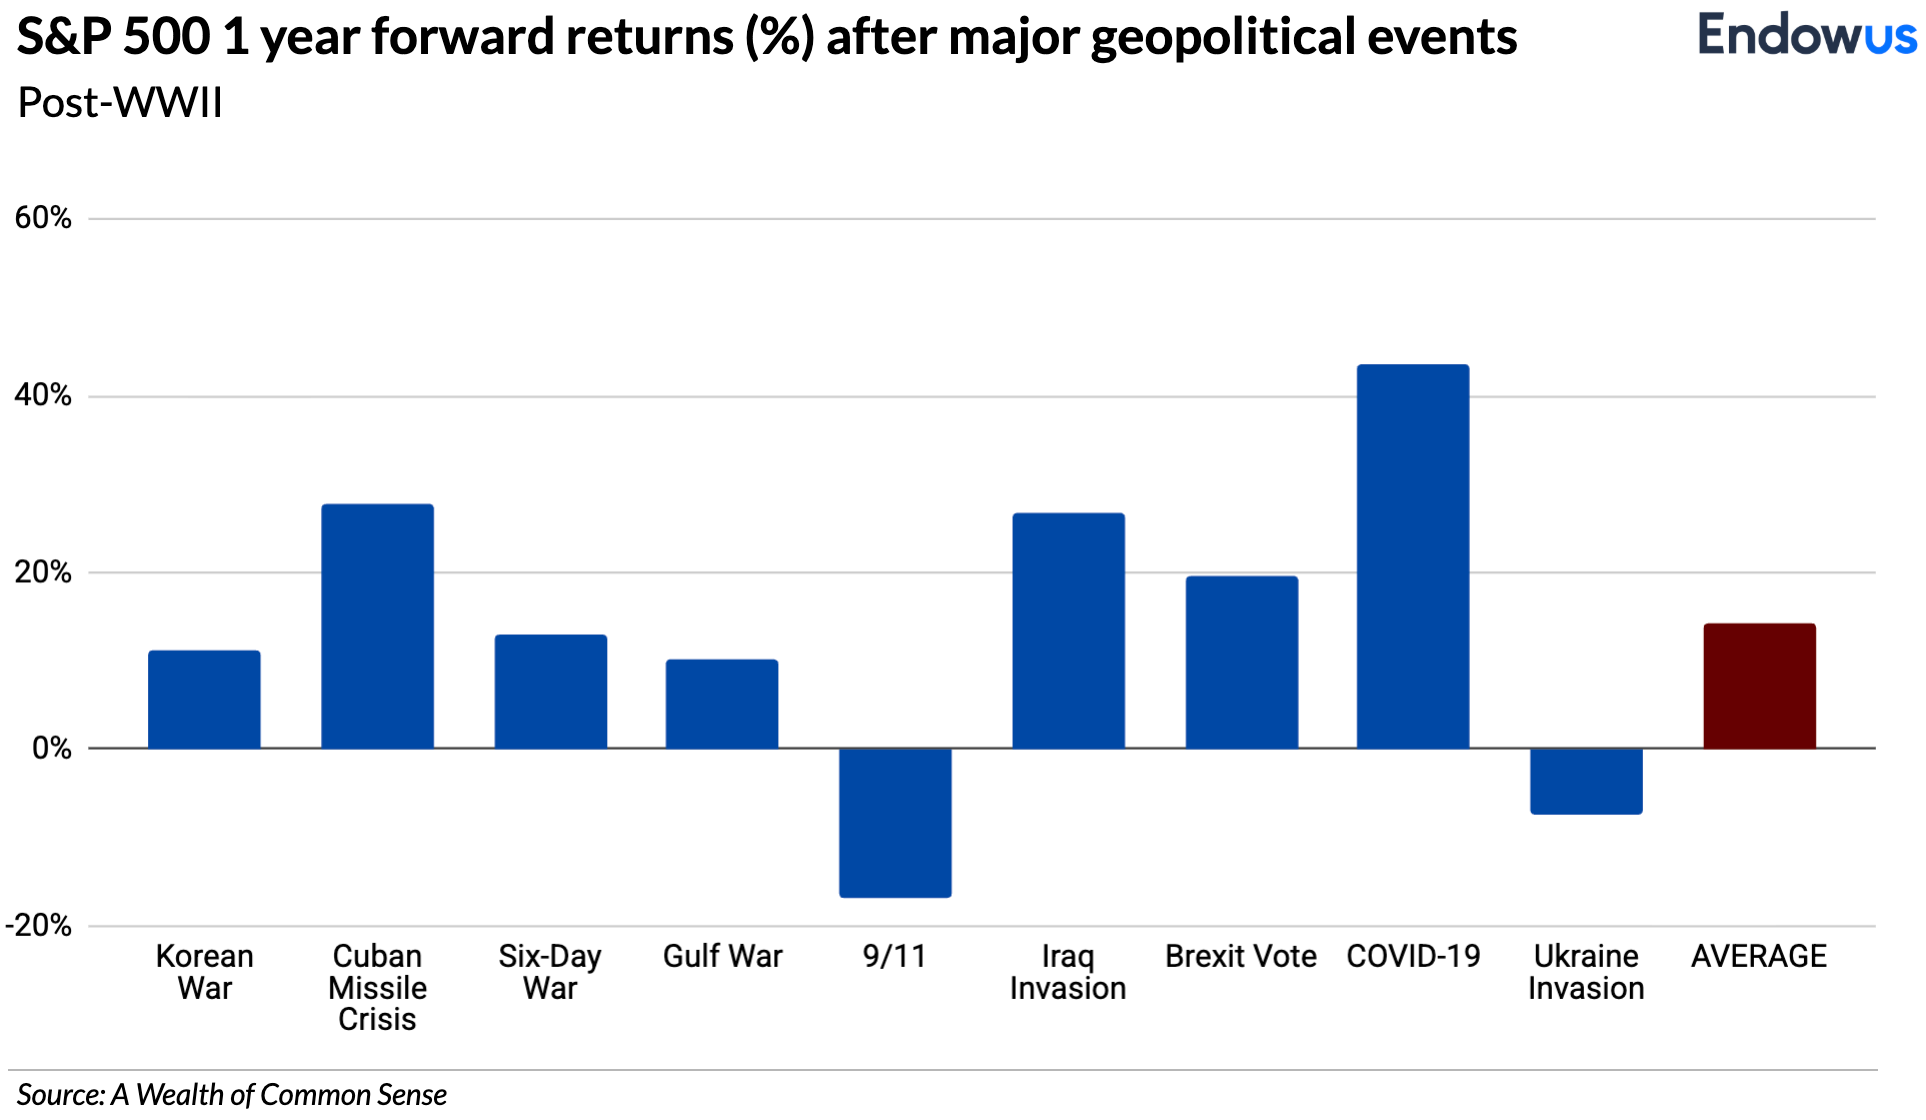
Let’s start with the obvious. The relationship between war and financial markets is counterintuitive. The U.S. stock market rose a combined 115% during World Wars I and II. The Dow gained an annualised 16% through the Korean War and nearly 43% in total during the Vietnam era. During the Cuban Missile Crisis—thirteen days when the world stood on the brink of nuclear annihilation—the Dow lost just 1.2%, then gained over 10% by year-end.
Maybe it’s because military and industrial spending rises along with investments to rebuild both infrastructure and arsenal, which probably leads to greater economic activity and could be considered creative destruction.
The pattern is remarkably consistent. Research from Carson Group, examining 40 major geopolitical events over 85 years, found that the S&P 500 lost an average of just 0.9% in the first month following a shock, then gained 3.4% over the subsequent six months. According to Hartford Funds, stocks were higher one year after the onset of armed conflict roughly 70% of the time, with average returns in the high single digits.
The reason why? Because markets ultimately respond to corporate earnings, economic growth, interest rates, and innovation—not the vagaries of geopolitical winds.
The real risks seem to be elsewhere
That said, dismissing every concern would be naive. The Iran conflict matters primarily through one channel: oil.
The Strait of Hormuz carries roughly 13 million barrels per day—about 31% of global seaborne crude flows. Goldman Sachs estimates the market is pricing in approximately four weeks of disruption, with Brent trading roughly US$13 above the firm’s estimated fair value of US$65. If the conflict is short-lived, crude can simply be stored on land in Middle Eastern producing countries, leaving cumulative supply unaffected. But if the Strait remains disrupted beyond that window, prices could surge into triple-digit territory through forced demand destruction.
For Singapore, in particular, this matters. Asia’s import-dependent economies are acutely sensitive to energy price shocks, which is also why the reactions were so sharp in countries like Korea. Higher oil feeds through to transport costs, utilities, and food prices. The European Central Bank has already flagged a potential 0.5 percentage point bump to eurozone inflation. Should Brent sustain above US$85 for an extended period, central banks globally—including the Fed—may be forced into a “higher-for-longer” posture on interest rates, complicating the rate-cut timeline markets had been counting on.
The AI correction is a bigger story than Iran
Ironically, a more consequential market eruption was already underway before the first missiles flew. The so-called “SaaSpocalypse” of early 2026 has erased nearly US$1 trillion from the S&P 500 Software and Services Index, as the rise of agentic AI triggered a fundamental re-rating of per-seat subscription business models. Forward earnings multiples for the software sector collapsed from 39x to 21x in just six weeks.
The contagion has not stopped at software. Private credit firms with significant exposure to technology lending have seen share prices fall 9–16%. The U.S. equity market capitalisation now was sitting at nearly twice GDP, well above dot-com-era levels, and the Magnificent Seven still represented roughly 35% of the S&P 500.
An estimated half of data centre investment is funded through private credit, according to Morgan Stanley, creating a web of interconnected exposures that could amplify any reversal.
The Yale School of Management statistics showed that AI-related capital expenditure accounted for 1.1% of U.S. GDP growth in the first half of 2025, while AI-related stocks drove 75% of S&P 500 returns since the launch of ChatGPT in November 2022. This is not a sideshow. A significant correction in AI valuations would have macroeconomic consequences, potentially more durable than a four-week disruption to oil shipping lanes.
The macro overlay is still important
Layer these together and the picture for 2026 becomes more textured.
Valuations were already high entering the year. The Case-Shiller price-to-earnings ratio for the U.S. market exceeded 40 for the first time since the dot-com crash. Arguably it has been high for a while and yet the market kept rising, and of course, it can go higher and it did during the dot-com bubble, but the margin for error is smaller.
The S&P 500 traded at 23 times forward earnings versus 14 times for the FTSE—a historically wide gap that speaks to the premium embedded in U.S. equities and the concentration risk therein versus most other global markets.
A National Bureau of Economic Research study published in February 2026 found that despite 90% of firms reporting no measurable impact from AI on workplace productivity, investment continued to pour in at unprecedented scale.
This could be seen as the classic late-cycle cocktail: elevated valuations, concentrated market leadership, geopolitical uncertainty, and a narrative—AI—that has driven both real investment and speculative excess. However, just as we would caution against excessive optimism on the way up that led to concentration risk, we do not want to jump on the bandwagon of bashing all things AI.
Finally, as I wrote in the first Science of Wealth article of the year, there was almost unanimous positivity among all the talking heads of Wall Street. None of this means a major correction beyond this initial move is imminent. But it does mean that the margin of safety for investors was already narrow coming into the year, and that the Iran conflict has arrived at a moment when markets were already recalibrating.
What the historical evidence tells us to do
The science of wealth is about using data and evidence to make better decisions—not to predict the future, but to understand the range of outcomes and position sensibly within it.
The evidence tells us three things:
Firstly, geopolitical events, however frightening, have rarely derailed markets over the medium to long term. The initial shock is real but typically short-lived. Investors who sold during past crises almost invariably regretted it.
Secondly, the true risk to watch is not the war itself but its second-order effects: a sustained oil supply disruption that reignites inflation and forces central banks to tighten further. This remains a tail risk, not a base case, but it demands monitoring.
Thirdly, the AI and software repricing is structural, not merely cyclical, and may prove more significant for portfolios than the geopolitical headlines dominating the news cycle.
For investors in Singapore and across Asia, the new prescription is unglamorous but time-tested: stay diversified across geographies, asset classes, and styles. Resist the urge to time markets around headlines. Ensure that your portfolio is not excessively concentrated in any single theme, however compelling. And remember that the cost of missing the recovery almost always exceeds the cost of enduring the drawdown.
Panic sells at the bottom, but the long arc of markets bends towards growth. This too shall pass. The question is not whether you will be invested when it does, but whether you were patient enough to stay the course.
Webinar: Travel, market and crypto bubbles
.png)
We are heading into bubble trouble

Endowus 2020 review and 2021 outlook


%20F1(2).webp)

.webp)


.webp)