

.webp)
.webp)
.webp)
.webp)


.webp)


%20(1).gif)

Register for the event
Endowus invites you to our exclusive event with Macquarie Asset Management, as we discuss unlocking opportunities in Infrastructure- a $1.3tn asset class.
This event is reserved for Accredited Investors (AIs) only. To register for the event, please indicate one of the following:
- Time in the market consistently outperforms timing the market. Missing even a handful of recovery days can cost you years of gains.
- A well-diversified portfolio, calibrated to your risk tolerance, is your most reliable tool through turbulent period.
- Dollar-cost averaging (DCA) - investing a fixed amount at regular intervals - helps smooth out the impact of volatility and positions you to potentially benefit from recoveries.
Market downturns are unsettling. But the evidence is unambiguous: investors who stay the course consistently outperform those who try to time their way through volatility. The data below shows why — across seven charts.
Regular, disciplined investments make sense in a downturn
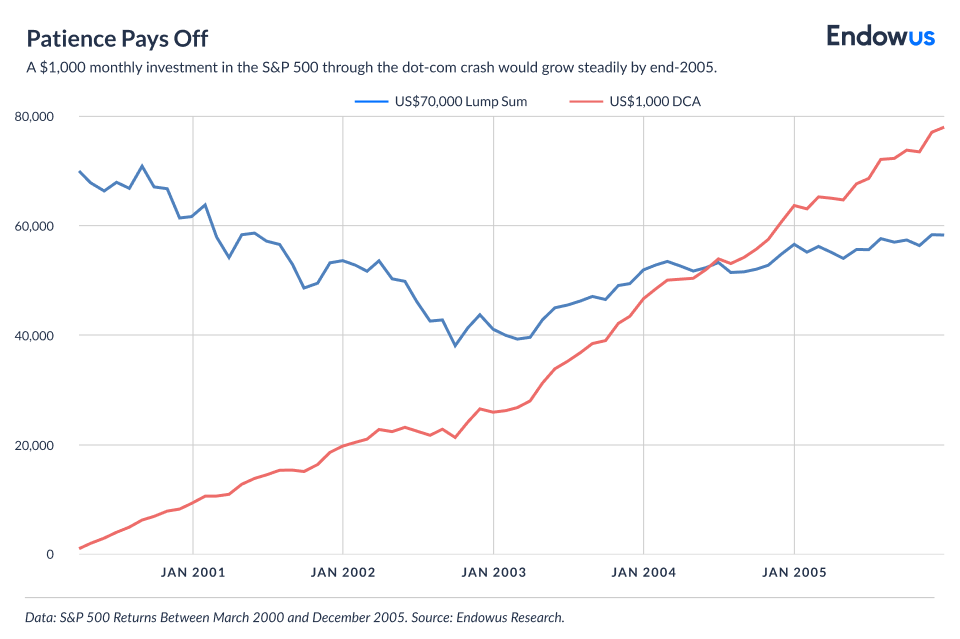
Consider the dot-com crash of the early 2000s. As you can see from the chart below, a $70,000 investment in the S&P 500 in March 2000 would have produced a negative return. Of course, investing at the index’s cheapest point—30 September 2002—would have returned 80% by end-2005. But timing that entry is nearly impossible.
On the other hand, an investor who put $1,000 into US equities every month between March 2000 and December 2005—70 months through one of the worst drawdowns in modern market history—would have accumulated a return of approximately 28% by the end of that period. Singapore bank annual deposit rates, by comparison, had fallen to 0.23% by end-2004.
DCA often beats lump sum investing during market routs
The chart below extends the analysis to other historical downturns. The conclusion is that a DCA portfolio built over 24 months of buying into US equities outperformed a lump-sum investment during every major crash—1974, 2000, and 2008. The mechanical discipline of DCA also serves a behavioural purpose: by removing the decision of when to invest, it removes the temptation to act on short-term fear.

Don’t miss out when the market recovers
Market declines are common, and they also tend to be temporary, lasting an average of 115 days. According to Fidelity, although nearly half of calendar years since 1980 up till 2025 have experienced a correction, the average annual return over the same period has been above 13%.
The April 2025 tariff-driven sell-off illustrates this vividly. By 13th March 2025, the S&P 500 had already fallen 10% from its February peak before "Liberation Day." The sweeping tariff announcement triggered a further 10.5% decline over just two days—the worst two-day loss in the index's history. Yet after the Trump administration announced a 90-day tariff pause on 9 April, the market recovered sharply. The S&P 500 turned positive for the year by 13 May 2025, with both the S&P 500 and Nasdaq closing at all-time highs by 27 June 2025.
The cost of missing recoveries is severe. An investor who stayed fully invested in the S&P 500 from 1990 to 2023 could have grown a $1,000 investment to US$27,221, excluding dividends. Missing just the five best days of that period would have reduced the final value by 37%. The more recovery days missed, the deeper the permanent damage to long-term returns.

Stocks can rebound after sharp declines
The Fama/French Total US Market Research Index—which has tracked US equity market data for nearly a century—shows a consistent pattern: positive returns in the one-, three-, and five-year periods following declines of 10% to 30%. One year after a 10% decline, the index returned an average of 11.8%. Five years out, average cumulative returns exceeded 50%.

Positive returns in equities are more likely over time
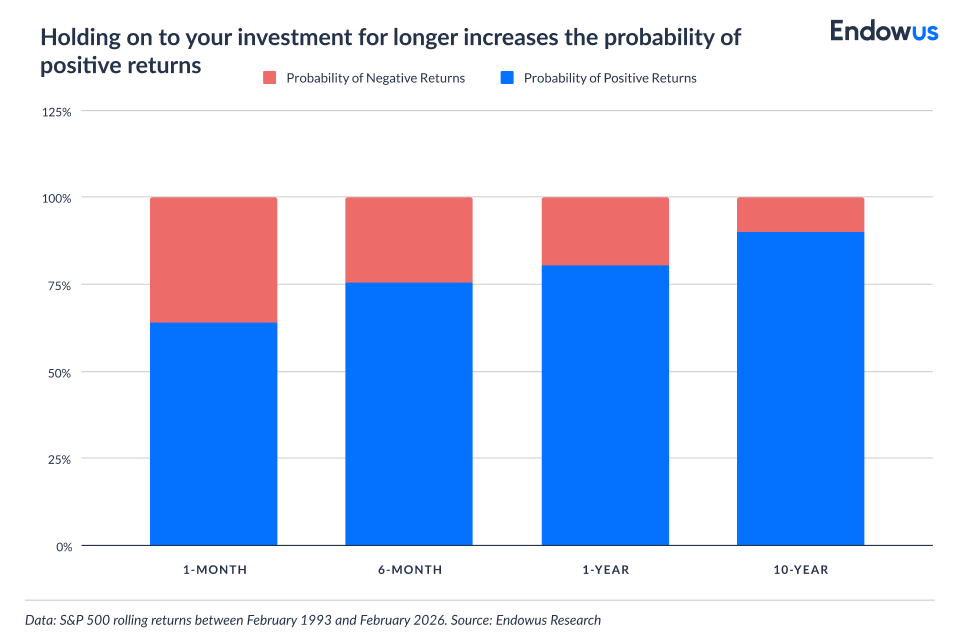
Typically, the longer we stay invested, the higher our chances of reaping positive returns.
Time is one of the most powerful tools available to an investor. As you can see from the figure below, holding US equities (S&P 500) for one month between February 1993 and February 2026 produced a positive return 66% of the time. Extending that holding period to a decade raised the probability of a positive return to 90% — and reduced the probability of a loss to 10%.
Diversify away risks and stay exposed to growth
Diversification does not guarantee a profit or eliminate risk—but it does two things consistently: it limits the depth of drawdowns in falling markets, and it preserves exposure to the recovery. As shown in the graph below, a hypothetical diversified growth portfolio of 49% US stocks, 21% international stocks, 25% bonds, and 5% short-term investments captured a significant share of equity returns between 2008 and 2014, while experiencing meaningfully smaller price swings than an all-equity portfolio—and easily outpacing an all-cash position across the same period1.

At Endowus, we advocate staying globally diversified across equities and bonds, and within each asset class.
You don’t need to be a genius to win in the long run
The instinct to sell is strongest precisely when selling is most costly. But the data is clear: even the worst-timed investments, held consistently through the compounding effect of long-term markets, produce meaningful returns. An investor who always bought at the market peak—the worst possible timing, every time—could still have earned an annualised return of approximately 8% and a total return of more than 1,400%, provided they stayed diversified and remained invested.

If you have capital on the sidelines, evidence suggests deploying it gradually throughout a downturn rather than waiting to call the bottom. No one can reliably predict short-term market movements. What the data does show, consistently, is that time in the market—combined with diversification and discipline—remains the most reliable path to long-term wealth accumulation.
At Endowus, we give investors broad exposure to global markets through a strategic, passive asset allocation with a long-term horizon, so that your wealth may grow steadily over time.
1The all-cash portfolio is calculated based on a portfolio consisting of $100,000 in an all-cash portfolio, the diversified portfolio is calculated based on a portfolio comprising 49% US stocks, 21% international stocks, 25% bonds, and 5% short-term investments. and the all-stock portfolio is calculated based on a portfolio consisting of 70% US stocks and 30% international stocks. These portfolios do not represent any actual Endowus portfolio or product.
Forget your password? It's a good thing for your investments

The lesson of Hyflux: What water and diversification have in common

Free lunch: Diversification in investing is a gift
.jpeg)


%20F1(2).webp)

.webp)


.webp)