


.webp)
.webp)
.webp)
.webp)






.webp)










%20(1).gif)

Register for the event
Endowus invites you to our exclusive event with Macquarie Asset Management, as we discuss unlocking opportunities in Infrastructure- a $1.3tn asset class.
This event is reserved for Accredited Investors (AIs) only. To register for the event, please indicate one of the following:
- Emerging market debt is conventionally divided into two sub-asset classes, based on currency: hard currency bonds are issued in and pay US dollars, while local currency bonds pay in the issuer's own currency and pass the exchange rate risk to the investor.
- Roughly 47% of the long-run return on the main hard currency index came from US Treasury duration rather than emerging market credit, while local currency returns are typically tied to the country’s currency performance. Past performance is not necessarily a guide to future performance or returns.
- A currency-hedged share class hedges only that share class against the fund's base currency, and does not hedge the fund's underlying emerging market currency exposure.
Emerging market (EM) governments and companies sold about US$450 billion of international bonds in the first half of 2026, roughly 15% more than in the same period of 2025. Mexico, Saudi Arabia, South Korea, Poland, Turkey, and Brazil each raised more than US$10 billion.
That is a sharp reversal for an asset class that saw three consecutive years of outflows through 2024, and it has drawn fresh attention to EM debt.
This asset class is broadly split into two sub-asset classes based on the currency of funding. The choice determines the risk-return profile and the main return driver (American interest rates for hard currency, emerging market exchange rates for local currency).
This article examines how hard currency and local currency emerging market debt are built, and what has actually driven returns for each. It then looks at how the two behaved through the 2022 rate shock and the 2025 dollar decline, and how investors in Singapore may size them within a diversified portfolio.
The dividing line is whose currency the debt is written in
An emerging market government that needs to borrow has two options. It can issue in its own currency, which leaves the lender carrying the exchange rate risk. Or it can issue in a hard currency (US dollars mostly, but also euros, sterling, yen, or Swiss francs) and carry that risk itself.
The key element to take into account is that sovereign and corporate issuers need to balance out the need to keep their coupons low with the risk of issuing in a currency that is not theirs. In order to repay debt in foreign currency, countries and corporations need to keep or source hard currency, which may not always be easy.
For many years, EM countries were practically forced to issue in hard currency, as their local currencies were too volatile for international investors. Most recently, however, this has changed. Most of the issuance is in local currency (though China issuing in local currency producing substantial skew).
The hard currency sleeve is the smaller share, but it remains a sizable investment opportunity: around US$1.4 trillion of sovereign debt and US$2.5 trillion of corporate debt as at December 2024, according to UBS Asset Management figures.
The two sleeves carry separate benchmarks - admitting different countries - on different standards, and they have different risk-return profiles.
What are the drivers of risk and return for hard currency EM debt?
A US dollar bond issued by Colombia pays US dollars, removing exchange rate risk for investors. But the bond is priced off the US Treasury curve, so the investor buys two risk premia at once: American interest rate risk, and emerging market credit risk (what are the odds that a specific country may not be able to repay its debt). The second is typically the reason for the allocation - investors who want exposure to the US Treasury curve can buy US Treasury bonds.
The proportion of returns attributable to US duration (basically, the US yield curve) is material. Artisan Partners' EMsights team, using data to 31 December 2025, found that US duration accounted for 47% of the EMBI Global Diversified's annualised return of 5.61% over the previous two decades. Just under half of what a hard currency emerging market bond fund paid its investors was a US Treasury return. Past performance is not necessarily a guide to future performance or returns.
As a reminder, duration measures how much value a bond portfolio loses when yields rise. Take a real example: a US$3.8 billion hard currency emerging market bond fund reported 6.45 years of duration and a gross yield to maturity of 6.74% (portfolio's annualised income expectations calculated on a gross basis as at the valuation date, and not guaranteed) at 31 July 2026.
A rise of just over one percentage point in yields may offset a full year of that portfolio's income by reducing the bond’s price. Conversely, a decrease in 1 percentage point may produce a broadly similar - in practice slightly large because of convexity - increase in the bond’s price.
The 2022 stress test showed the importance of US rates movements
The EMBI Global Diversified, proxied by iShares Emerging Markets Government Bond Index Fund (IE), fell 17.8% in 2022. That year, many country-specific headlines were negative. Russia left the index on 31 March after the invasion of Ukraine and the sanctions that followed. Sri Lanka defaulted in April, Ghana suspended payments in December, and Zambia had already been in default since 2020. Past performance is not necessarily a guide to future performance or returns.
But the defaults were not the main event, as those countries carried small index weights, compressed further by the index's own diversification rules. The dominant force was US Treasury yields. The 10-year rose from a December 2021 monthly average of 1.47% to 3.62% a year later, a move of 215 basis points, which had an outsized impact on an index with high duration.
Then, something counterintuitive happened. The Federal Reserve has cut its policy rate by 175 basis points since September 2024. Over the same period the US 10-year Treasury yield has risen, from around 3.8% to approximately 5% as of the time of this article. This is because hard currency emerging market debt is priced off the long end of the Treasury curve, not off the policy rate. “The Fed is cutting” is therefore not, on its own, good news for this asset class.
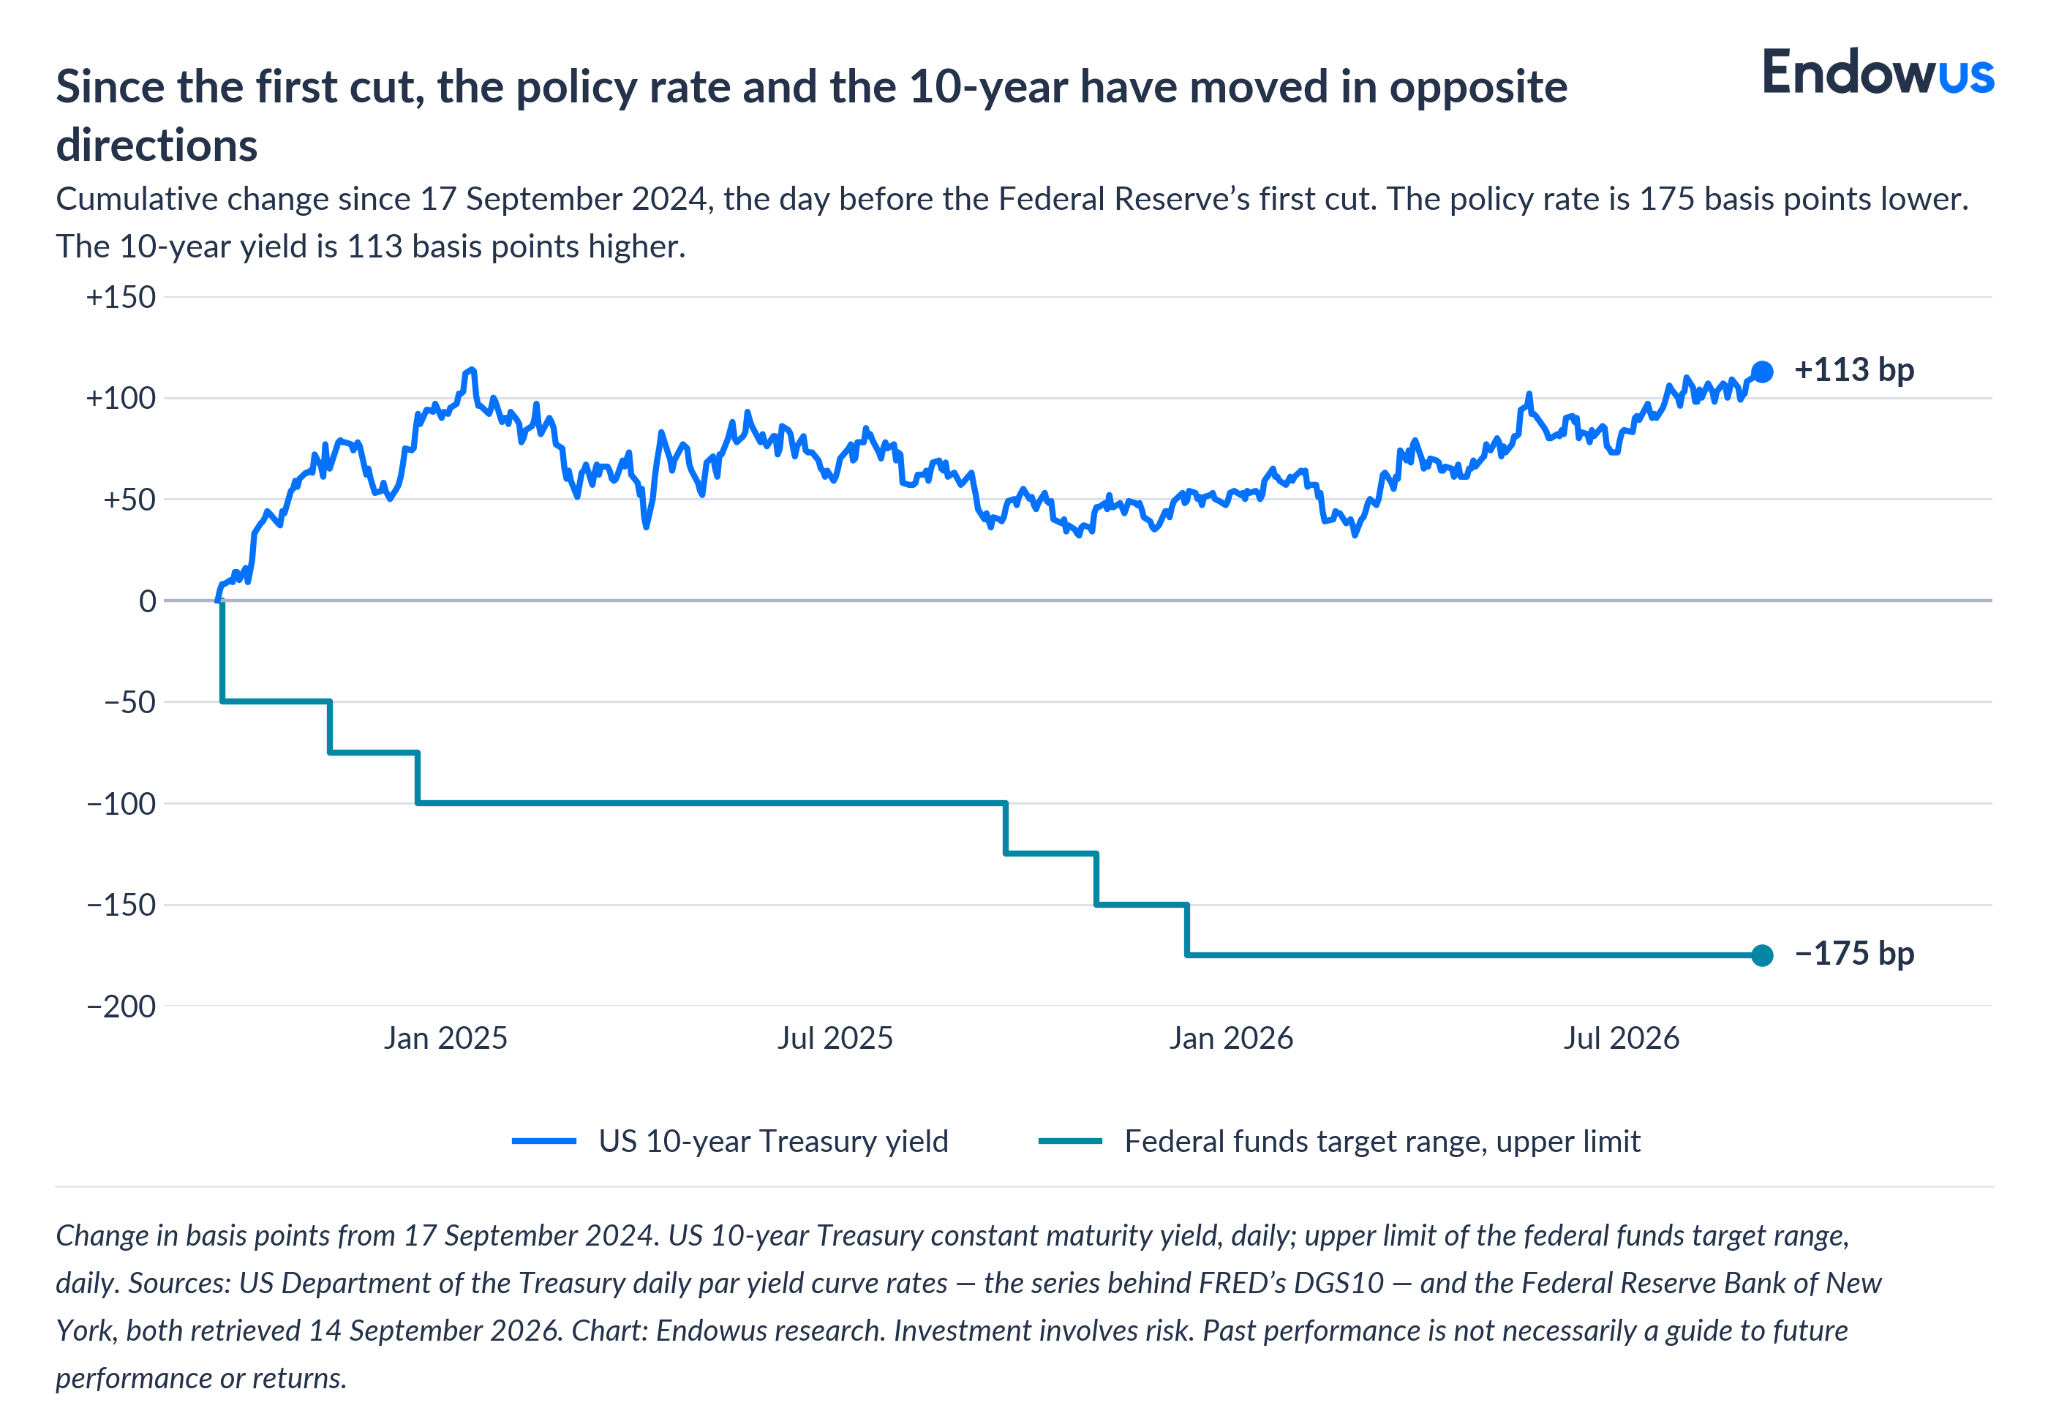
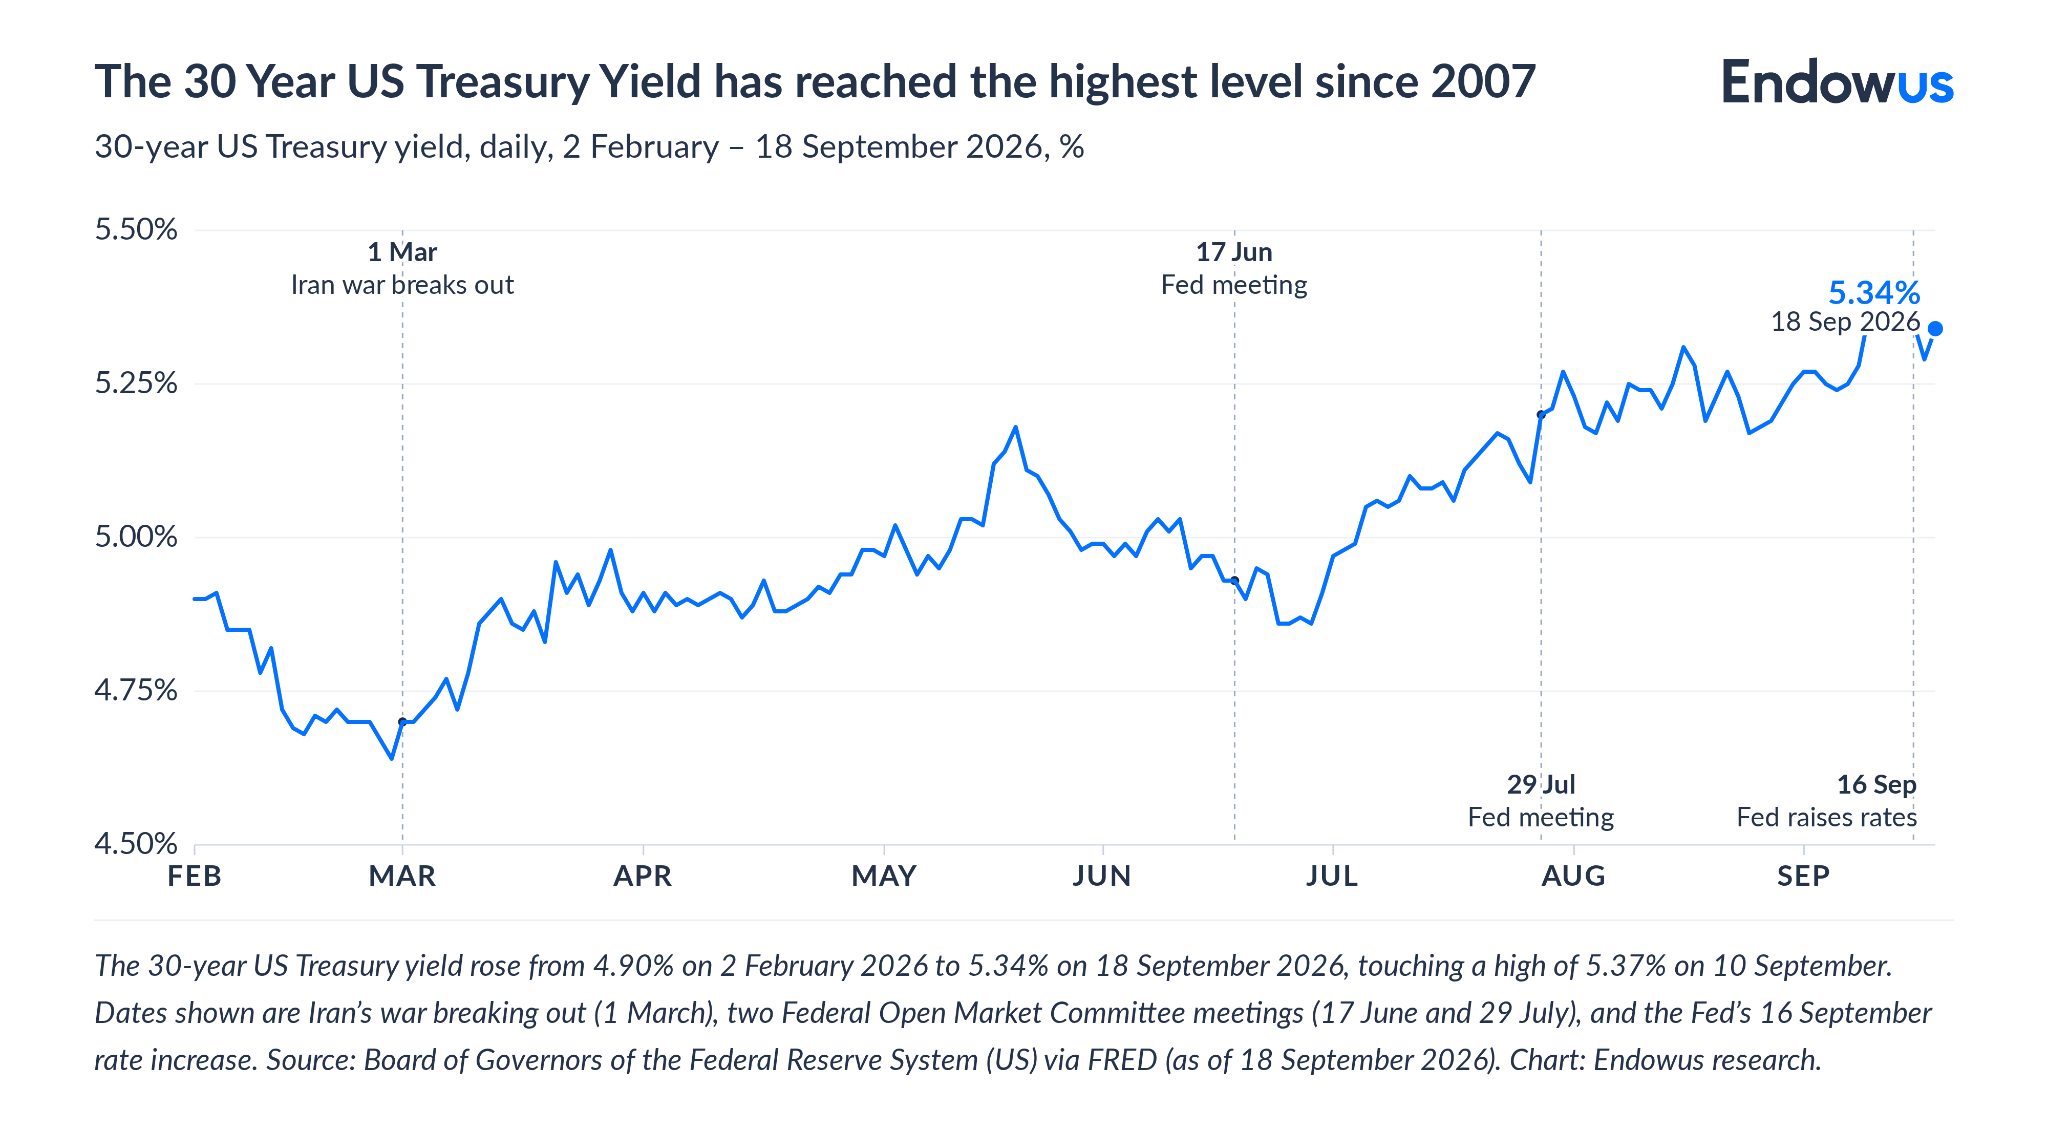
This is a conversation worth resuming, as The Federal Open Market Committee raised the rates by 25 basis points - up to 3.75% to 4.00% - on 16 September 2026. The 30-year Treasury has reached its highest level since 2007.
What are the components of an “emerging market” index?
Two features of the EMBI Global Diversified may be interesting to share with readers who are interested in learning more.
First - how sovereign bonds are included in the index.
A country qualifies if its gross national income per capita sits below the index income ceiling, or its cost of living below the index purchasing power parity ratio, for three consecutive years. For 2026 J.P. Morgan set the ceiling at US$24,325 and the ratio at 53.2. Gulf sovereigns entered from January 2019 and phased in through 30 September 2019 at a combined weight of roughly 11.2%. Second - defaulted bonds are not excluded from the index.
As of 31 December 2025, the index included Venezuela at 1.00%, Lebanon at 0.44%, and Ethiopia at 0.13%, all in default. Passive exposure to this index therefore includes credits in active restructuring. Defaulted paper trading at very wide nominal spreads also pushes the index's average spread and yield figures upward, so the headline index yield overstates what a holder is likely to realise. In practice, physically replicating funds may hold less defaulted paper than the index weight implies, because those bonds are often illiquid and hard to source, which introduces tracking error of its own.
Diversification is “enforced” via capping. J.P. Morgan computes the average eligible debt outstanding per country, caps the largest country at twice that average, includes countries below the average in full, and interpolates the ones in between. It then applies a hard 10% weight cap per country and redistributes any excess to smaller countries. The effect is to compress large issuers such as Mexico, Turkey, and Brazil, and to lift the tail of smaller frontier sovereigns. Together with diversification, exposure to small, low-rated, less liquid credits has also increased.
The restructuring cycle is largely resolved, and recovery values dispersed widely
The four years from 2022 contain a complete sovereign debt cycle: a default wave, negotiation through 2023, exchanges closing in 2024, and market access restored in 2025 and 2026. Gabon raised US$920 million in July 2026, which tells you the market has reopened even to weaker credits. The dispersion of outcomes is the more useful lesson.
Recovery values in this cycle ranged from roughly 25 cents in the unresolved Lebanese case to roughly 71 cents in Ghana. Dispersion that wide means a sovereign default may have different consequences and different haircuts, and the IMF notes that emerging market sovereign bond restructurings take an average of around 13 months to implement, due to the complex legal, regulatory, and financial structuring required.
While these are headline numbers, the ten-year average emerging market sovereign default rate over 2014 to 2024 was 2.20%, against 2.70% for US high yield. The market most associated with default risk in retail perception defaulted less often than the domestic US high yield market over that window.
Sri Lanka's exchange also produced two genuine firsts in sovereign finance. Its macro-linked bonds adjust principal up or down against nominal US dollar gross domestic product (GDP) thresholds. Bondholders receive automatic capital reinstatement if the economy outperforms, and take a further haircut if it does not. Its governance-linked bond carries a 75 basis point coupon step-down if specified fiscal transparency conditions are met by 2028. Symmetric risk-sharing between a sovereign and its creditors, at scale, had not been done before.
In local currency debt, the currency drives short-run returns
Local currency emerging market debt inverts the trade. The investor lends in the borrower's own money, so there is no sovereign obligation to find US dollars — but the investor now carries the exchange rate risk. That moves the dominant driver of returns from American interest rates to emerging market currencies.
How much it dominates depends almost entirely on the holding period. According to Robeco, between January 2003 and January 2025, currency returns showed a 0.95 correlation with total local currency emerging market debt returns. State Street's quarterly attribution shows the mechanism working month by month.
Note the pattern in the interest income column - it never turns negative. The currency column swings from −1.41% to +1.60%, which means carry is the typically reliable return for this asset class, while currency returns tend to be more volatile.
Does the local currency index use a different definition of “emerging”?
The GBI-EM Global Diversified applies the same income test as its hard currency sibling, but with two additional filters. It excludes countries with explicit capital controls, on the reasoning that an index an investor cannot replicate is not a useful benchmark. It also requires a new market to reach at least 1% weight before it can enter.
Those two filters are why the local currency index holds 19 countries where the hard currency index holds 68. Artisan Partners identified 48 further investable local markets sitting outside the benchmark as at 31 December 2025. The index is also restricted to fixed coupon sovereign bonds, excluding floating rate, callable, puttable, and convertible instruments, with a minimum issue size of US$1 billion for local issues.
Why are there three countries with a 10% weight? India reached it after one of the largest index events in the market's history: J.P. Morgan announced inclusion on 22 September 2023, began phasing the country in at the end of June 2024 over ten months. India hit the 10% ceiling by March 2025. China had entered the same way, at 1% per month from February to November 2020.
How has local currency emerging market debt performed?
As the currency is a natural driver of short-term performance for EM local debt, dollar swings in the past two years have been the driver of the asset class’ performance.
The US dollar index fell 10.8% in the first half of 2025 — its worst first half since 1973, when it fell 14.8%. In its own EM November 2025 update, likely based on the J.P. Morgan GBI-EM Global Diversified index, State Street attributed 8.2 percentage points of the 17.51% 2025 return (up until 28 November 2025) to currency alone: currency was roughly 47% of that year's return.
Then the dollar turned. The index fell 2.25% in the first quarter of 2026 and recovered 3.85% in the second. It stood at 1.82% for the year to 31 July 2026 — a dead heat with the hard currency index at 1.84%.
Ten calendar years show what that variability looks like when it is not compressed into an average.
Four of ten years were negative in US dollar terms, and 2020 returned less than a single year of the index's coupon (meaning currency return was negative). Two of those negative years, 2021 and 2024, were also very positive for other asset classes.
While volatility appears high, in the long run, figures depend heavily on the window chosen. UBS Asset Management, using Bloomberg data over 2003 to 2024, put local currency emerging market debt at 5.31% annualised with 10.68% volatility, against 6.57% and 8.37% for hard currency sovereigns. State Street, over the near-identical window of 31 December 2002 to 31 December 2024, put local currency at 3.5% with 6.7% volatility against 5.4% and 6.2% for hard currency. The two are not reconcilable from the published material, and we would not pick between them. Both, however, show local currency debt delivering less return than hard currency with more volatility over roughly two decades.
It took thirteen years for a dollar investor to get back to level
The clearest way to see what currency does to this asset class over a long horizon is to assess the index level, in USD.
On a total return basis, the J.P. Morgan GBI-EM Global Core index stood at 141.72 on 30 April 2012. On 31 August 2026 it stood at 164.20. That is a cumulative gain of 15.86% over 14.3 years, or about 1.03% a year, according to Bloomberg data. Over the same period the index yielded between roughly 4% and 7% in coupon throughout. The index has performed better in the past two years. However, past performance is not an indication nor a predictor of future returns or performance.
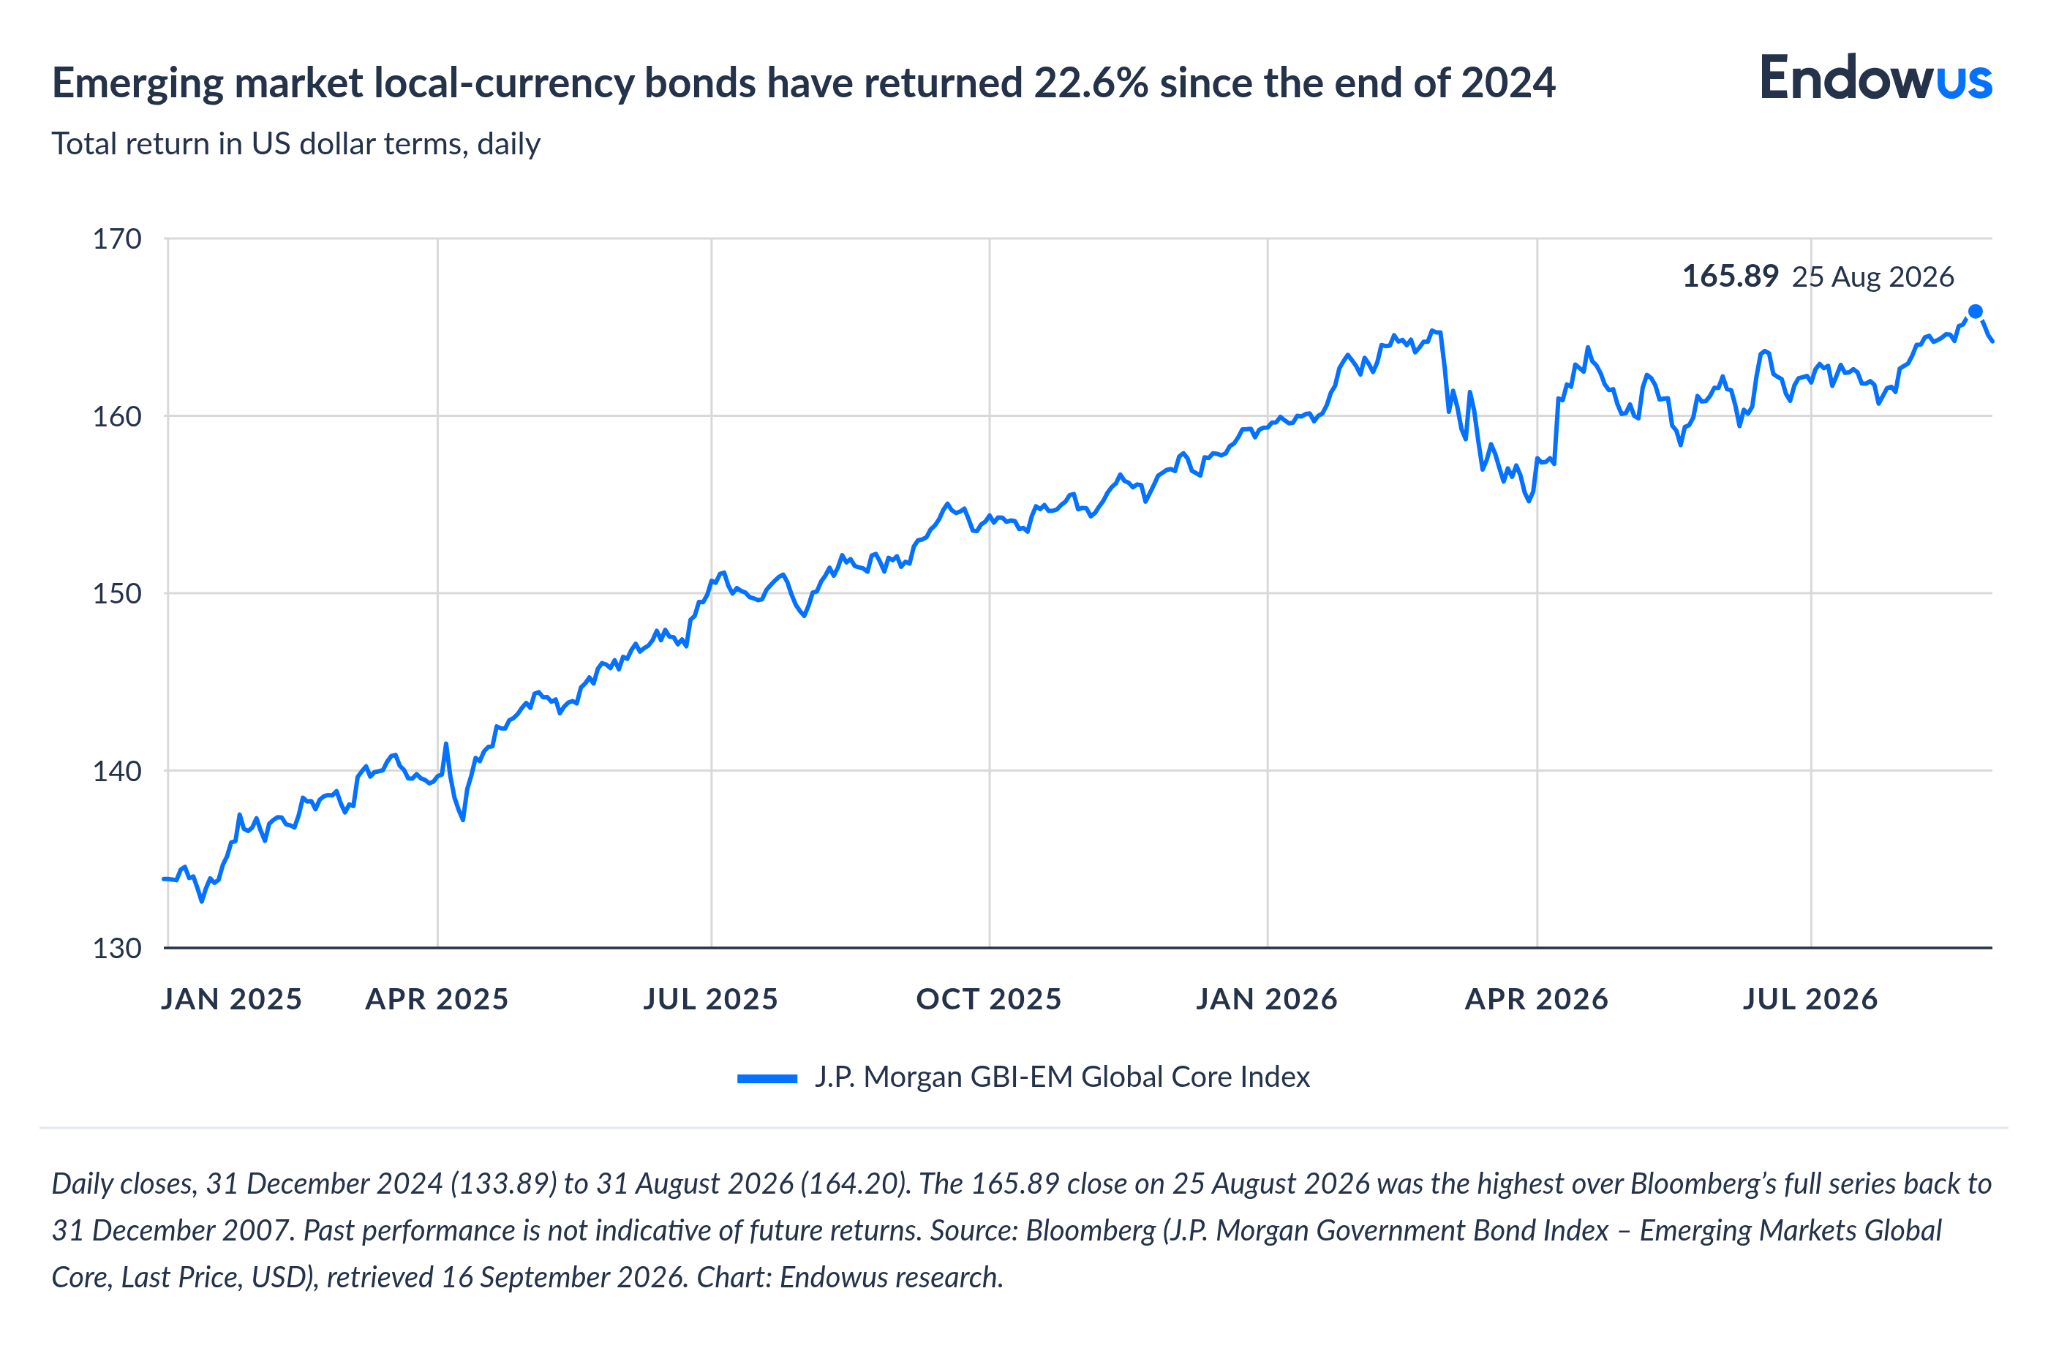
Overall, putting together both local currency and hard currency emerging market debt returns, just under half of what hard currency debt paid investors was driven by US Treasury returns. For local currency, the exchange rate consumed rather more than all of what local currency debt paid investors over fourteen years.
Emerging market central banks are not all moving in the same direction
A common shorthand holds that emerging market central banks are cutting rates, which would support local bond prices. In the second quarter of 2026 they moved both ways, and the split matters for anyone treating the asset class as one position.
Bank Indonesia raised rates three times, by 100 basis points in total, to 5.75%. The Philippine central bank raised twice to 4.75%, and Colombia raised 75 basis points to 12%. In August 2026, Brazil cut 50 basis points to 14%, Mexico cut 25 to 6.50%, and Hungary cut rates down to 5.5%. The Reserve Bank of India and the People's Bank of China held.
That dispersion is visible in the yields on offer, which range across an extraordinary spread for what is described as one asset class.
Thailand at 2.22% and China at 1.68% both yield less than the 10-year US Treasury, while Turkey yields more than eighteen times China. Exposure to the index is exposure to a wide range of rate levels.
A hedged share class only hedges the USD final returns
It is important to state that a currency-hedged share class hedges the share class currency against the fund's base currency - it’s the so-called “NAV hedging” mechanism - it does not hedge the fund's underlying currency exposures. Neuberger states the mechanism quite clearly: only the value of the hedged share class is hedged, which means there is no impact on the returns of the broader fund.
More in depth, if the fund's base currency is US dollars, and its assets are Brazilian real, Mexican peso, Indonesian rupiah, and sixteen other emerging market currencies, a Singapore dollar hedged share class only removes the US dollar to Singapore dollar leg.
Where the underlying emerging market exposure itself is hedged, the effect is also real. UBS figures for 2003 to 2025 put a hedged local currency series at 3.9% annualised with 3.6% volatility, against 5.31% and 10.68% for the unhedged series over 2003 to 2024. Volatility falls by roughly two-thirds and return falls by about 1.4 percentage points, though those are two different UBS publications over two different windows and the comparison is indicative rather than controlled.
Two further costs sit outside most factsheets. Hedged share class distributions embed the interest rate differential between the two currencies, so a difference in quoted yield between hedged classes reflects rate differentials and not superior income from the bonds. And the local currency indices are calculated gross of withholding tax.
What both halves have in common right now is thin compensation
For all their differences, the two sleeves face the same valuation problem in September 2026.
J.P. Morgan Global Research described emerging market sovereign credit spreads as being at 20-year tights on 1 July 2026, with limited room to tighten further, and its base case is that spreads finish 2026 modestly wider. Fourteen months earlier, on 30 April 2025, the same market sat at 433 basis points, the 71st percentile of its ten-year history. The move from historically wide to twenty-year tight happened quickly.
Emerging market government debt currently sits just below 60% of GDP on an index-weighted basis, against over 110% for developed markets. Corporate net supply was negative in 2025 for the fourth consecutive year and is expected to be negative for a fifth. Azerbaijan and Oman regained investment grade in 2025, and Paraguay, Serbia, and Morocco are expected to reach it for the first time. Fund flows have been positive in almost every period of 2026, with local currency taking US$11.4 billion in the first quarter against US$6.0 billion for hard currency.
However, even if the macro environment turns positive, there is no guarantee that performance will meaningfully improve.
Investment implications
The first decision is not which manager to use. It is which of the two sleeves answers a question you actually have.
The second decision is sizing, with volatility being a good reason to keep low exposure. Local currency debt, proxied by the iShares UCITS ETF that tracks the JPM GBI-EM index (in US dollar) has a 3-year volatility of 8% as of 31 August 2026. Hard currency debt (JPM EMBI, proxied by the iShares ETF that tracks the index) has a duration of 6.59 years and a volatility of 6.86%, as of June 30, 2026. Both are better understood as satellite allocations alongside a core bond holding.
The third decision is around cost. On a fund whose net excess return over its own benchmark has been roughly one percentage point a year, an ongoing charge of 1% or more is not a detail.
Our advisers (endowus.com/financial-advisor-singapore) can help you assess whether emerging market debt is appropriate for your goals, time horizon, and risk profile, and at what weight. For investors who like to explore the options to emerging markets, Endowus Fund Smart offers curated strategies from top-class fund managers including the Franklin Templeton, PIMCO, Goldman Sachs and Neuberger Berman offered across various share classes (Class F, Class I, Class A, etc.) and different hedging options (FX-Hedged, AUD Hedge) for different investor needs at institutional share classes with no trailer fees. Find out more on Fund Smart now.
Frequently asked questions about emerging market debt
What is the difference between hard currency and local currency emerging market debt?
Hard currency emerging market debt is issued in a major currency, most often US dollars, so the borrower carries the exchange rate risk and the investor takes US interest rate risk plus emerging market credit risk. Local currency debt is issued in the borrower's own currency, so the investor carries the exchange rate risk and takes emerging market interest rate risk. They have separate benchmarks, admit different countries, and have historically behaved differently.
Which one has performed better?
UBS Asset Management figures for 2003 to 2024 put local currency debt at 5.31% annualised with 10.68% volatility, against 6.57% and 8.37% for hard currency sovereigns. T. Rowe Price, over a near-identical window, puts local currency at 4.9% with 11.6% volatility against 6.4% and 8.9%. Past performance is not necessarily a guide to future performance or returns.
Why does an emerging market bond index include Saudi Arabia?
Because index providers define “emerging market” by written tests rather than by economic development. The hard currency sovereign index admits countries whose gross national income per capita sits below a ceiling of US$24,325 for 2026, which is how Gulf sovereigns qualify.
Does a currency-hedged share class protect me from emerging market currency risk?
No. A hedged share class hedges that share class against the fund's base currency only. If the fund holds Brazilian real and Indonesian rupiah bonds and its base currency is the US dollar, a Singapore dollar hedged class removes the US dollar to Singapore dollar exposure and leaves the emerging market currency exposure intact. Read the share class hedging disclosure in the fund's offering documents before assuming otherwise.
How much emerging market debt should I hold?
That depends on your objectives, time horizon, existing portfolio, and tolerance for drawdown, and it is not a question that has a general answer. What the data supports is treating it as a satellite allocation rather than a core bond holding: local currency debt has carried roughly 1.7 times as much annualised volatility as its yield, and hard currency debt drew down 28% peak to trough in 2022. Speak to a financial adviser about your own circumstances.
Forget your password? It's a good thing for your investments

The lesson of Hyflux: What water and diversification have in common

Free lunch: Diversification in investing is a gift
.jpeg)


%20F1(2).webp)

.webp)
.webp)






.webp)