


.webp)
.webp)
.webp)
.webp)






.webp)












%20(1).gif)
Register for the event
Endowus invites you to our exclusive event with Macquarie Asset Management, as we discuss unlocking opportunities in Infrastructure- a $1.3tn asset class.
This event is reserved for Accredited Investors (AIs) only. To register for the event, please indicate one of the following:
- A bond's yield and its price move in opposite directions: when interest rates rise, existing bond prices fall, and vice versa — and the sensitivity of that price change is measured by duration.
- Yield curve dynamics offer investors practical strategies beyond simple buy-and-hold: riding the curve, managing duration actively, and building barbell or laddered portfolios can all affect the risk-return profile of a fixed income allocation.
- Credit spreads — the additional yield a bond offers above a risk-free benchmark — reflect market pricing of default and liquidity risk, and are an important input when assessing whether additional yield is worth the additional risk.
Bond markets move in ways that are not always intuitive. When central banks raise interest rates, bond prices typically fall — sometimes sharply. When rates fall, bond prices typically rise.
Understanding why this happens — and how to manage it — requires two foundational concepts: yield and duration. These two measures explain most of what drives fixed income returns. They also underpin the practical strategies that fixed income investors use to position portfolios along the yield curve, manage interest rate sensitivity, and reach for additional return through credit risk.
This article explains yield and duration from first principles, introduces the yield curve and how it is used in practice, and describes three key fixed income strategies: riding the curve, barbell positioning, and spread investing.
What is bond yield?
A bond's yield is the total return an investor receives from holding the bond to maturity, expressed as an annual percentage. It accounts for both the coupon payments the bond pays and the difference between the price paid and the face value received at maturity.
When a bond is issued, its coupon rate is fixed. But bonds trade in secondary markets, and their prices change daily. A bond with a face value of S$1,000 and a 4% annual coupon will pay S$40 per year regardless of what happens to its market price. If you buy that bond at S$950, your effective yield is higher than 4%, because you are paying less than face value but still receiving S$40 in coupons and S$1,000 at maturity.
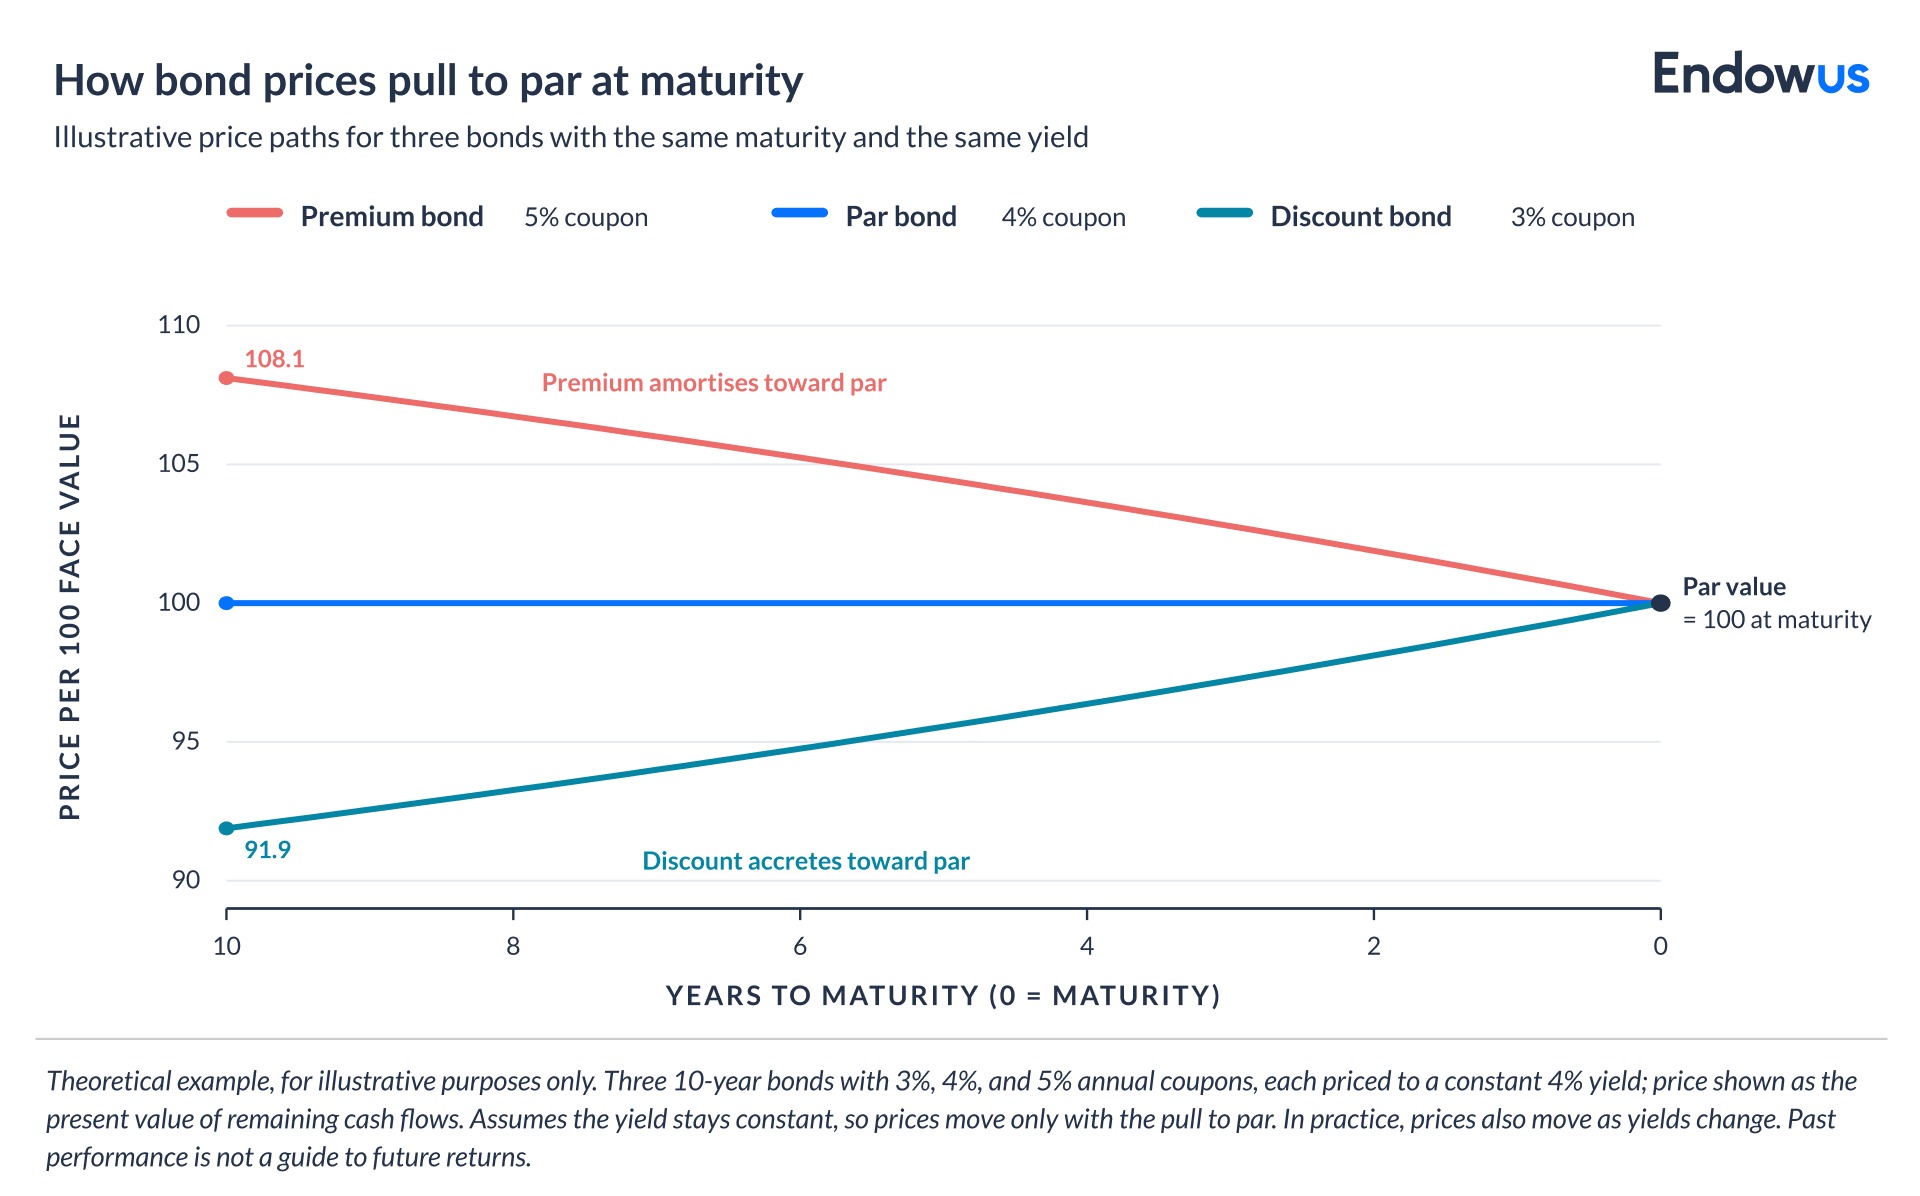
This is the inverse relationship that underpins all fixed income analysis: as price goes down, yield goes up. As price goes up, yield goes down. When commentators say that bond yields have risen, they mean bond prices have fallen — the two statements are mathematically equivalent.
The most commonly cited yield measure is yield to maturity (YTM): the discount rate that equates the present value of all future cash flows (coupons and face value) with the bond's current price. It is the cleanest single-number representation of a bond's return if held to maturity and if all coupon payments are reinvested at the same rate.
What is duration — and why does it matter?
Duration is a measure of a bond's sensitivity to changes in interest rates.
There are two measures of duration - Macaulay duration and modified duration - but both underpin the same basic concept: the higher the duration, the more sensitive the bond's price is to a given change in interest rates.
Macaulay duration is a measure of time. It represents the weighted average time until a bondholder receives the bond's cash flows (coupons and principal), where each cash flow is weighted by its present value as a proportion of the bond's total price. It is expressed in years. A 7-year Macaulay duration means that, on a present-value-weighted basis, the average time to receive the bond's cash flows is seven years. For a zero-coupon bond, Macaulay duration equals its time to maturity, since there is only one cash flow at the end.
Modified duration is a measure of price sensitivity. It estimates the approximate percentage change in a bond's price for a 1% (100 basis point) change in yield. A bond with a duration of 7 years may lose roughly 7% of its price if rates rise by 1 percentage point. A bond with a duration of 2 years will lose roughly 2%.
Duration is driven by three factors: maturity, coupon rate, and current yield. Longer-maturity bonds have higher duration because more of their cash flows are received further into the future. Lower-coupon bonds have higher duration because a larger share of total return comes from the final principal repayment rather than interim coupon payments.
For investors, duration has a practical aspect: it quantifies how much “rate” risk you are taking in a fixed income portfolio - in other words, how sensitive is your portfolio to changes in interest rates. A portfolio with an average duration of 10 years is taking meaningfully more interest rate risk than one with an average duration of three years.
The yield curve — what is it, and what its shape tells investors
The yield curve is a line that plots the yields of bonds of the same credit quality — typically government bonds — across different maturities, from short-term (three months or one year) to long-term (ten or thirty years).
Under normal conditions, longer-maturity bonds offer higher yields than shorter-maturity bonds. Investors demand additional compensation for locking up capital for longer and accepting more interest rate risk. This produces a normal, upward-sloping yield curve.
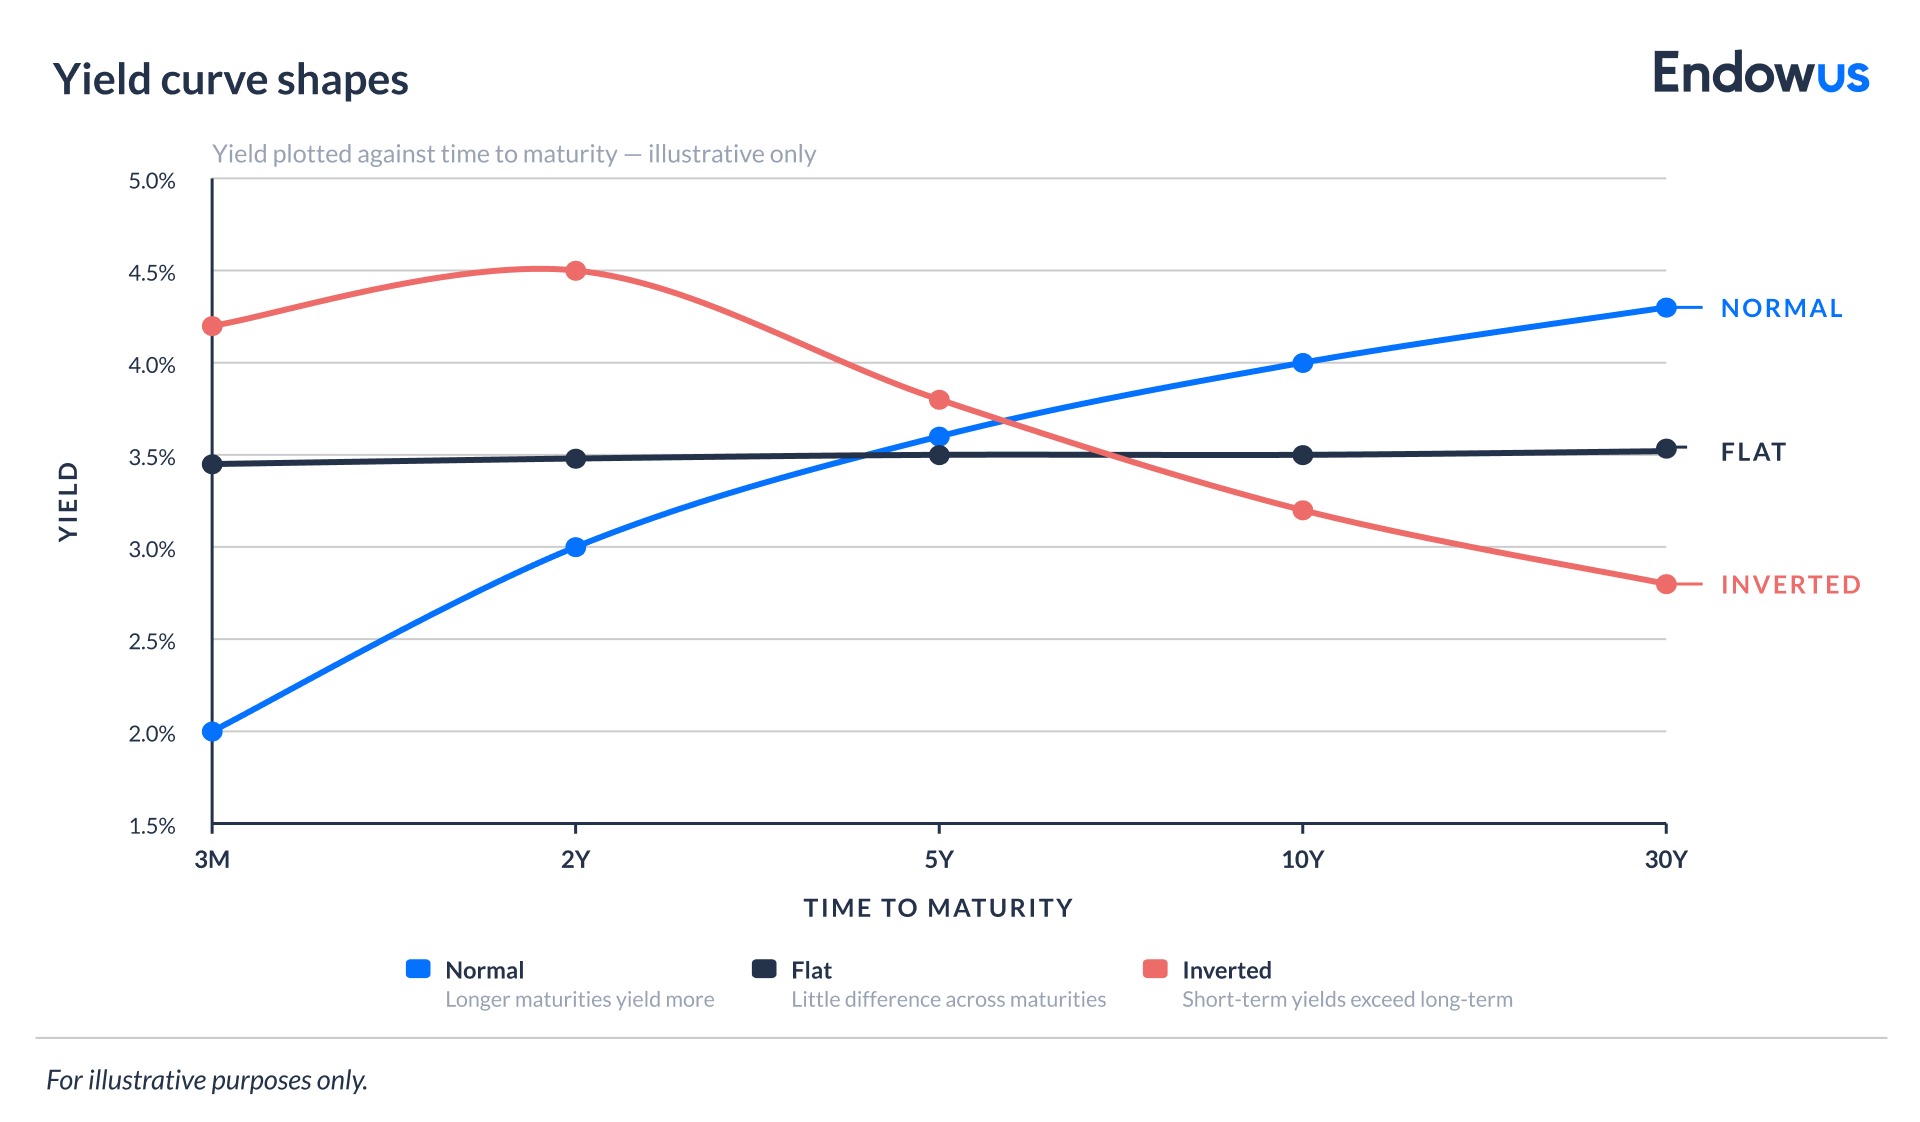
The yield curve does not always slope upward. When short-term rates are higher than long-term rates the curve becomes inverted. An inverted yield curve reflects market expectations that rates will eventually need to fall as economic growth slows.
A flat yield curve, where short and long rates are similar, often appears during transitions between monetary policy cycles.
The shape of the yield curve matters practically because it affects the relative attractiveness of bonds at different maturities, and it shapes the return available from active positioning strategies.
Riding the curve: a strategy for normal yield environments
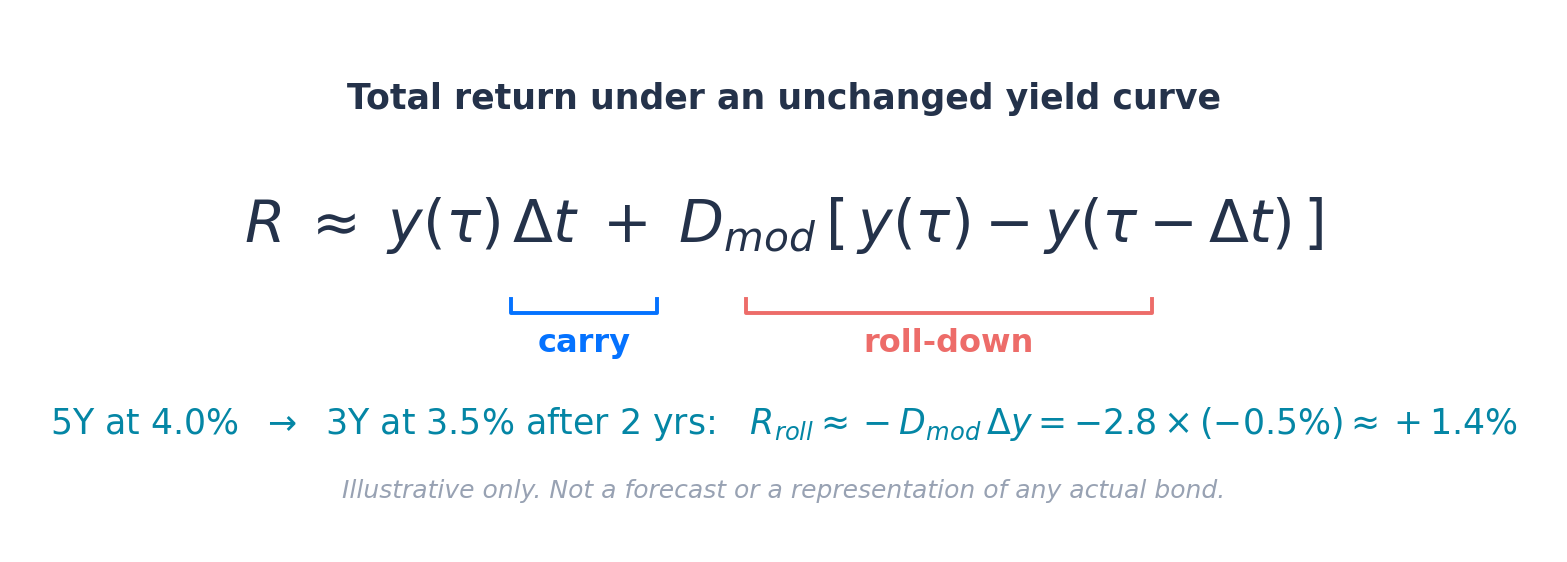
"Riding the curve" — sometimes called "rolling down the yield curve" — is a fixed income strategy that captures return from the natural steepness of an upward-sloping yield curve, without requiring any change in interest rates.
The logic is straightforward. If the yield curve is upward-sloping, a five-year bond today will be a four-year bond in one year. If the yield curve remains unchanged, that bond will now sit at a lower point on the curve — carrying a lower yield, and therefore a higher price. The investor earns not just the coupon, but also a capital gain from the bond's movement down the curve.
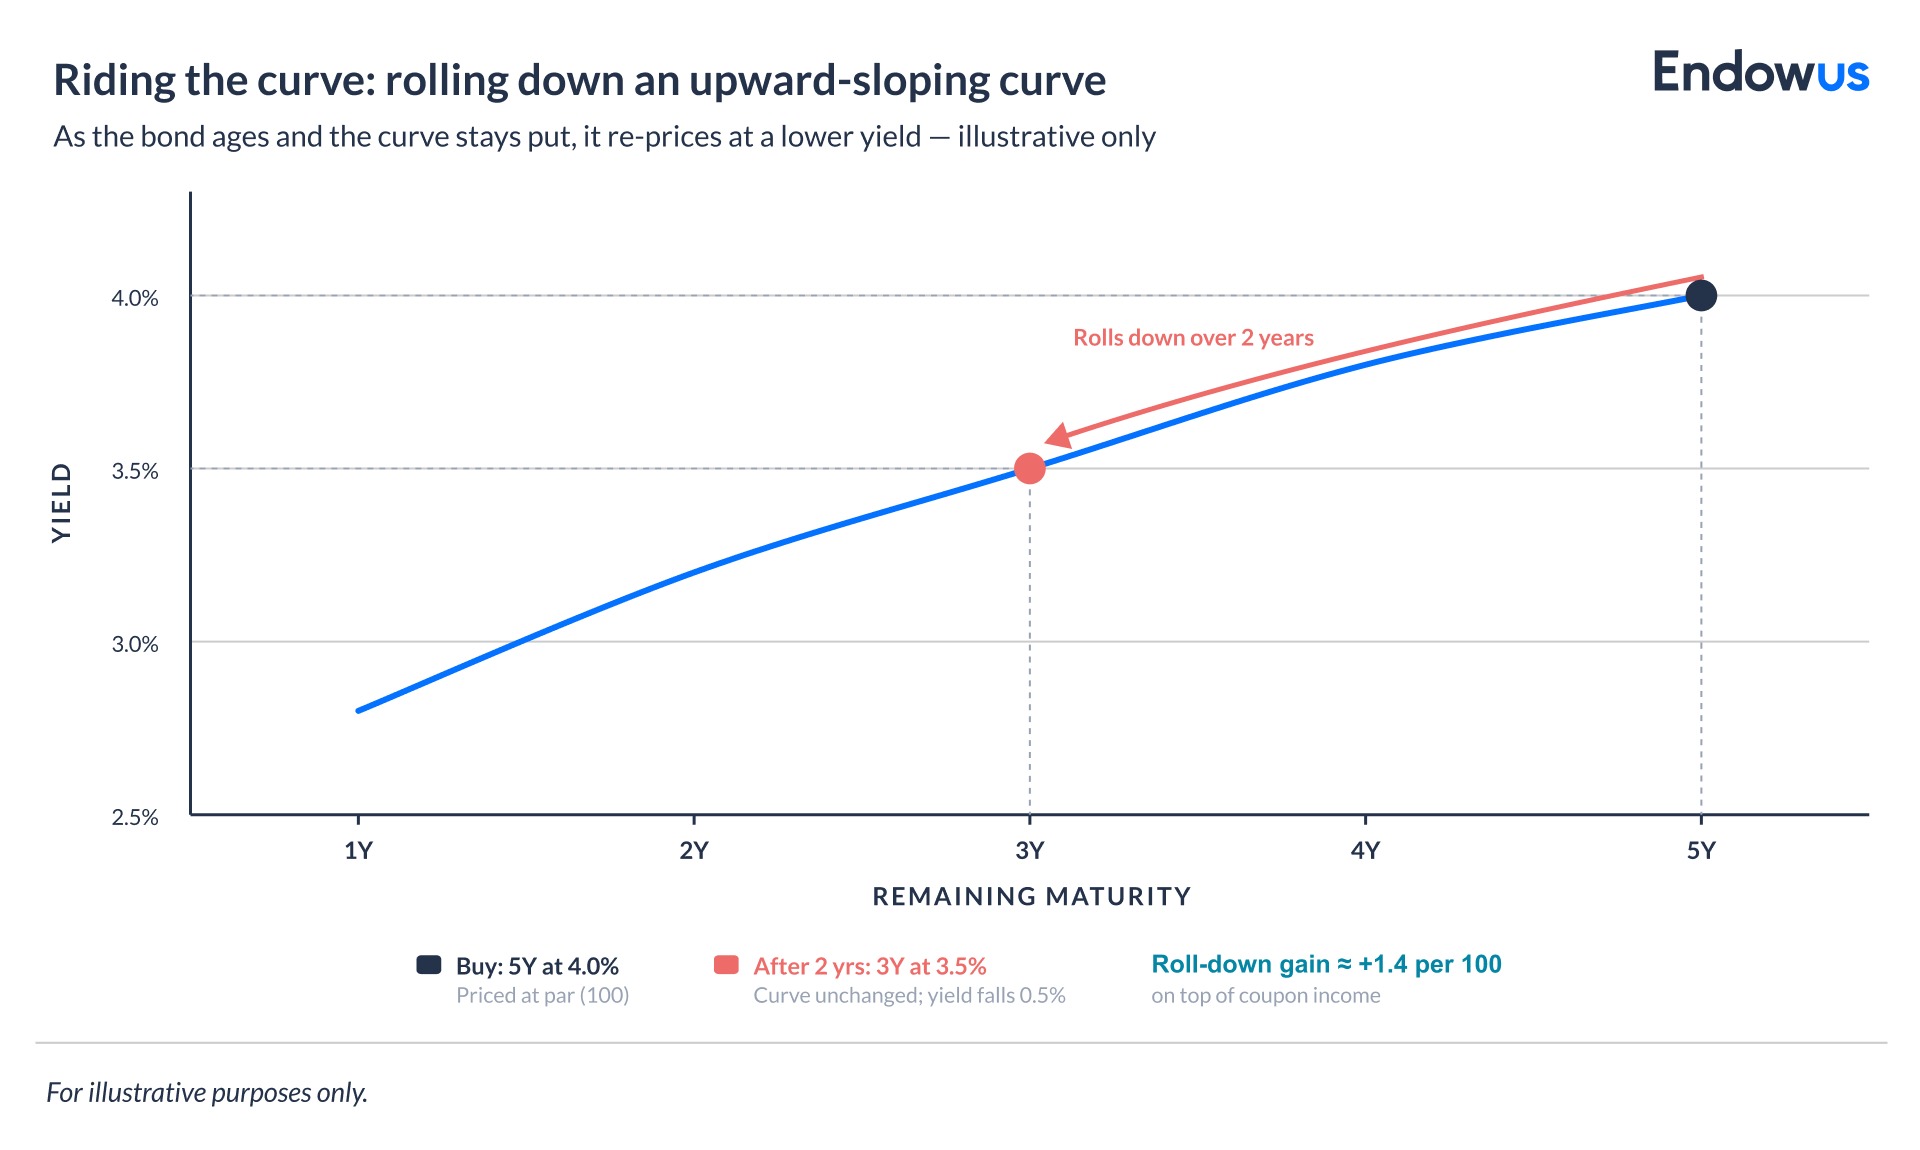
For example: if the three-year yield is 3.5% and the five-year yield is 4.0%, buying the five-year bond and holding it for two years means it matures into the three-year point of the curve. If yields remain stable, the bond would have likely re-priced based on a 3.5% yield — may generate a capital gain in addition to the coupon income.
The strategy is most effective when the yield curve is steep, when investors have a medium-term holding horizon, and when rates are not expected to rise significantly. It is less effective on a flat or inverted curve, because there is no premium to capture from the bond rolling to a shorter maturity.
For the math nerds reading this, below is the equation:
Barbell positioning: combining short and long duration
A “barbell” strategy concentrates bond holdings at two extremes of the yield curve — typically in very short-term bonds (one to two years) and very long-term bonds (ten to thirty years) — while holding little or nothing in the middle.
The short end provides liquidity and low interest rate sensitivity (low duration). The long end provides higher yield and price appreciation potential if rates fall.
Compared with a bullet strategy of the same overall duration — one that concentrates holdings at a single maturity point — a barbell may outperform when the yield curve flattens, meaning long-end yields fall relative to short-end yields: its long-maturity leg carries the greater interest rate sensitivity, and so appreciates more than the rest of the portfolio as long rates decline. The same sensitivity works against the barbell when the curve steepens and long-end yields rise, since the long leg then falls furthest in price.
A “laddered” strategy — spreading holdings evenly across maturities — sits between the barbell and bullet in terms of risk. Laddering is more commonly used for income predictability (bonds maturing at regular intervals provide cash flows) than as a return-optimisation strategy.
Credit spreads: reaching for yield — and what it costs
Not all bonds carry the same credit quality. Government bonds are typically considered the lowest-risk fixed income instruments in their local currency. Corporate bonds, asset-backed securities, and high-yield bonds all carry some probability of default — and must therefore offer higher yields to attract investors.
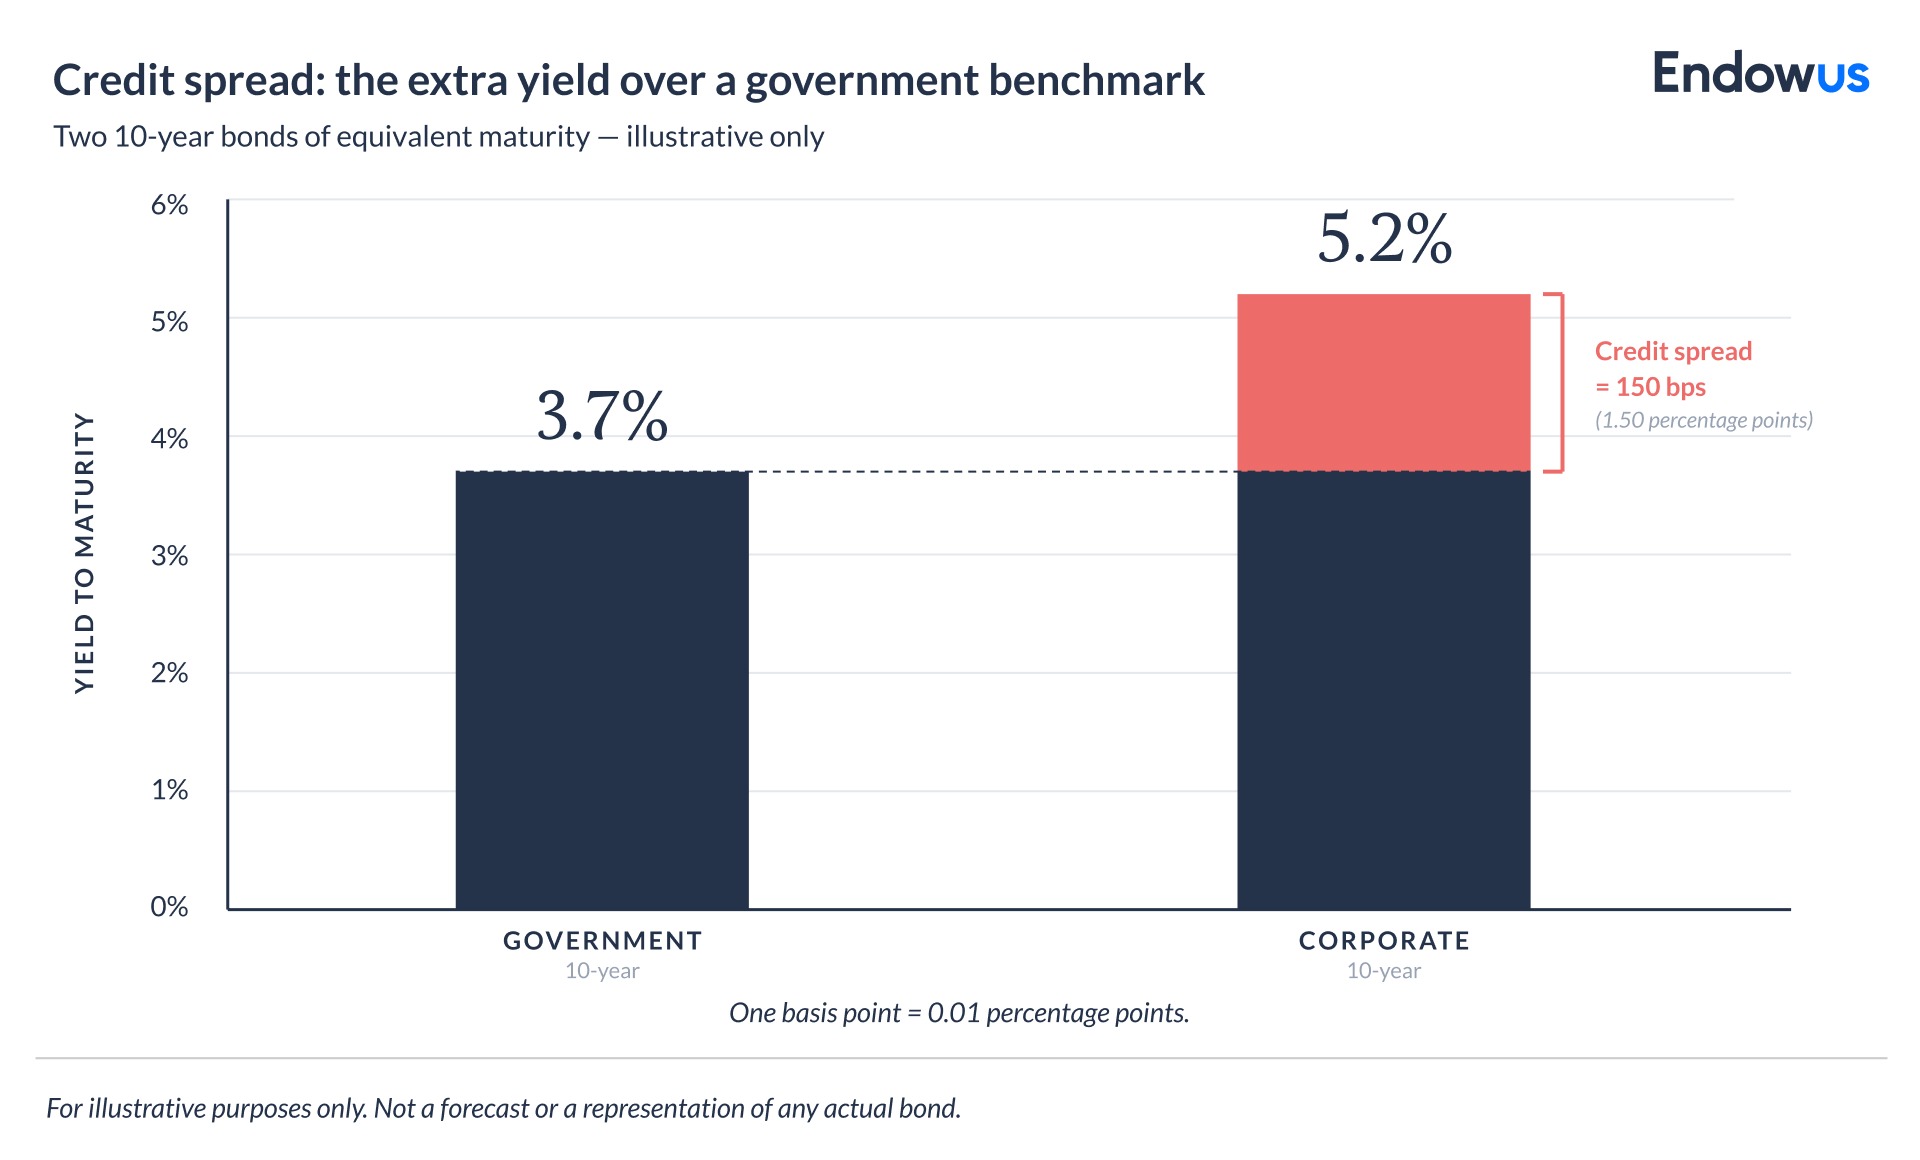
The credit spread is the difference in yield between a corporate bond and a government bond of equivalent maturity. It is expressed in basis points (one basis point equals 0.01 percentage points). A ten-year corporate bond yielding 5.2% against a ten-year government bond yielding 3.7% carries a spread of 150 basis points.
Credit spreads are not static. They tend to widen when markets are stressed — as investors demand a higher premium (more compensation) for default risk and reduced liquidity — and compress when economic conditions are benign and investors are willing to accept lower compensation for risk. The spread cycle often leads or coincides with economic cycles.
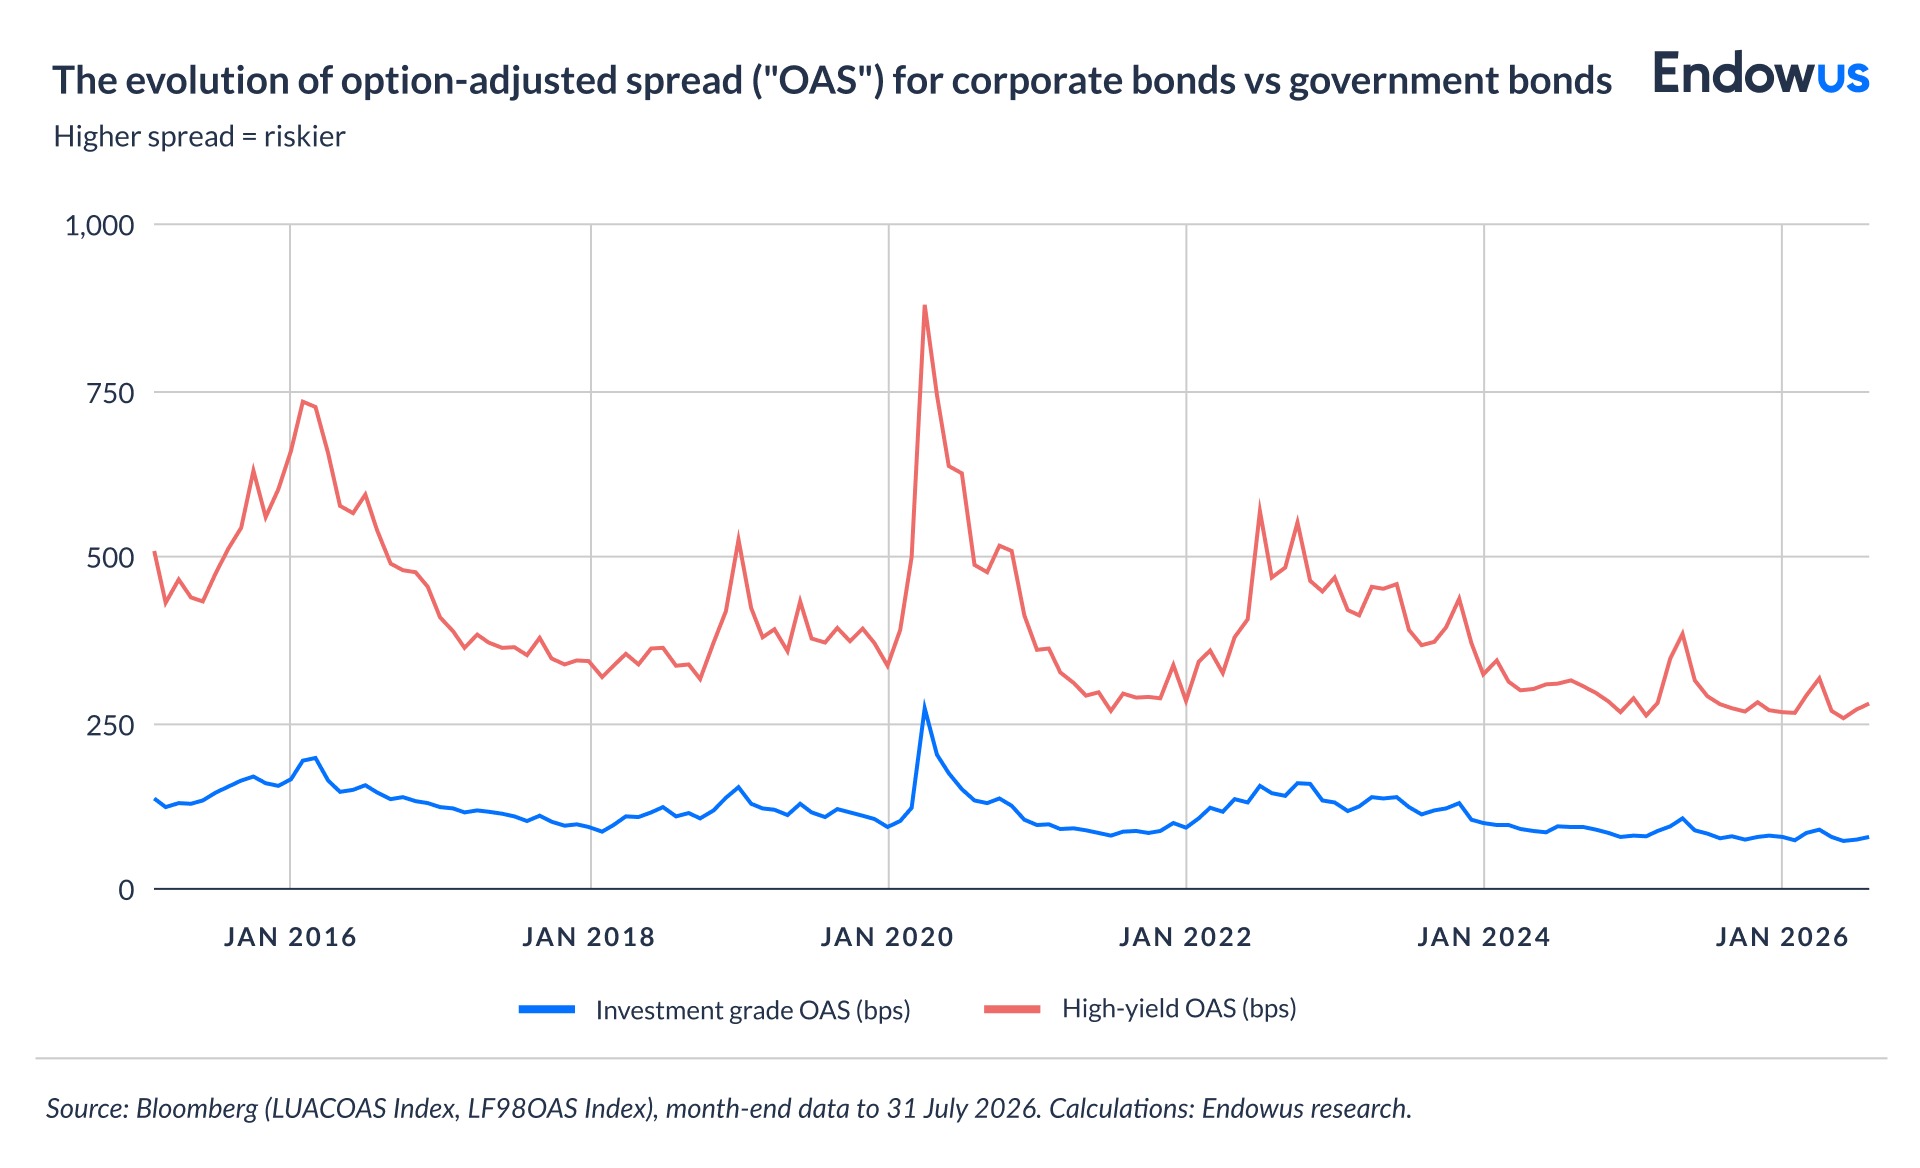
For investors, credit spread analysis involves asking a specific question: is the additional yield on offer sufficient compensation for the additional default and liquidity risk? That question requires an assessment of the issuer's financial position, the economic environment, and the current level of spreads relative to historical norms.
Investment-grade corporate bonds — typically rated BBB- or above by major credit agencies — tend to offer more modest spreads (often 50–150 basis points above comparable government bonds in normal conditions) but carry substantially lower default risk than high-yield bonds, which may offer spreads of 300–600 basis points but with correspondingly higher default probability.
Duration and credit spread are not independent. A corporate bond with high duration and a wide credit spread is carrying two sources of risk simultaneously: interest rate sensitivity and default risk. Investors should consider both dimensions, not just the headline yield.
Investment implications
Fixed income is often presented as the conservative, low-risk portion of a portfolio — and in some contexts, it is. But the past several years have illustrated that a poorly structured bond allocation can lose substantial value when interest rate conditions shift.
Beyond that, fixed income is not just about “income.” There is an element of capital appreciation - as interest rates fall, for instance - that needs to be factored in.
Overall, the concepts in this article — yield, duration, the yield curve, riding the curve, barbell positioning, and credit spreads — are key to evaluating a fixed income allocation. Understanding them allows investors to ask better questions: Is this bond portfolio carrying too much duration risk relative to my time horizon? Am I being compensated for the credit risk I am taking? Is the yield curve steep enough to make rolling strategies worthwhile?
On Endowus, our Income portfolios are constructed with these principles in mind — balancing yield, duration, and credit quality across market conditions. Explore Endowus Income Portfolios here.
Alternatively, investors interested in building their own fixed income strategy across different durations, yields, and credit qualities can explore Endowus Fund Smart, which curates a selection of funds managed by experienced money managers with proven expertise in navigating fixed income market cycles.
More broadly, our advisers can help assess whether the current structure of your fixed income investments is appropriate for your goals, time horizon, and risk tolerance.
Read more in our fixed income series:
- Part 1: Bond yields and duration: what every investor needs to know
- Part 2: Investment Grade vs High Yield: understanding the credit spectrum
- Part 3: Building a fixed income allocation: from building blocks to portfolio
Frequently Asked Questions
What is the difference between yield and coupon?
The coupon is the fixed interest payment a bond makes annually, expressed as a percentage of face value. Yield accounts for the coupon payment and any difference between the purchase price and face value. When a bond trades below face value, yield is higher than the coupon. When it trades above face value, yield is lower.
Why do bond prices fall when interest rates rise?
Existing bonds pay fixed coupons. When new bonds are issued at higher rates, older bonds become less attractive — investors will only buy them at a lower price that brings their effective return in line with the new rate. This inverse relationship between price and yield is a mathematical identity, not a market opinion.
What is a good duration for a bond portfolio?
There is no universally correct duration. A shorter-duration portfolio (two to four years) typically carries less interest rate risk but also offers lower yield. A longer-duration portfolio (eight to twelve years) tends to offer higher yield potential but more price volatility when rates move. The right duration depends on the investor's time horizon, income needs, and view on interest rates.
What does an inverted yield curve mean for investors?
An inverted yield curve — where short-term rates exceed long-term rates — has historically preceded economic slowdowns. For investors, it may affect the attractiveness of riding-the-curve strategies (which require a normal, upward-sloping curve to work) and may signal that holding cash or short-duration bonds could be appropriate until the curve normalises.
What is the difference between investment-grade and high-yield bonds?
Investment-grade bonds are issued by borrowers rated BBB- or above by major credit agencies, and carry lower default risk. High-yield (or sub-investment-grade) bonds are rated below BBB- and offer higher yields to compensate for greater default probability and lower liquidity. Both categories carry interest rate risk in addition to credit risk.
Forget your password? It's a good thing for your investments

The lesson of Hyflux: What water and diversification have in common

Free lunch: Diversification in investing is a gift
.jpeg)


%20F1(2).webp)

.webp)
.webp)






.webp)