


.webp)
.webp)
.webp)
.webp)






.webp)












%20(1).gif)

Register for the event
Endowus invites you to our exclusive event with Macquarie Asset Management, as we discuss unlocking opportunities in Infrastructure- a $1.3tn asset class.
This event is reserved for Accredited Investors (AIs) only. To register for the event, please indicate one of the following:
The AI trade that carried markets through the better part of the second quarter cracked in July with the Philadelphia Semiconductor Index (SOX Index) pulling back 20.6% and Nasdaq 100 down 6.6% for the month. The overall market, however, was remarkably calm with the S&P 500 flat, and the majority of the underlying equity sectors finishing in positive territory.
The Fed held rates at 3.75% on 29 July with 3 dissents, and as of publication, the futures market is pricing at least one hike by year end—a contrast to expectations of two cuts at the start of this year.
Global equity
Global equities were essentially flat in July on a USD basis. While the picture looked steady at the index level, there was a lot of movement underneath, with value outperforming growth by more than 6 percentage points globally.
Semiconductors were front and centre. The sector led the AI rally up until June, but then dramatically pulled back in July. The drawdown was amplified by forced deleveraging of hedge fund positions, and margin calls for leveraged single-stock ETFs. Many fund managers were caught off guard by the sudden move, given that it happened during a broadly positive earnings season.
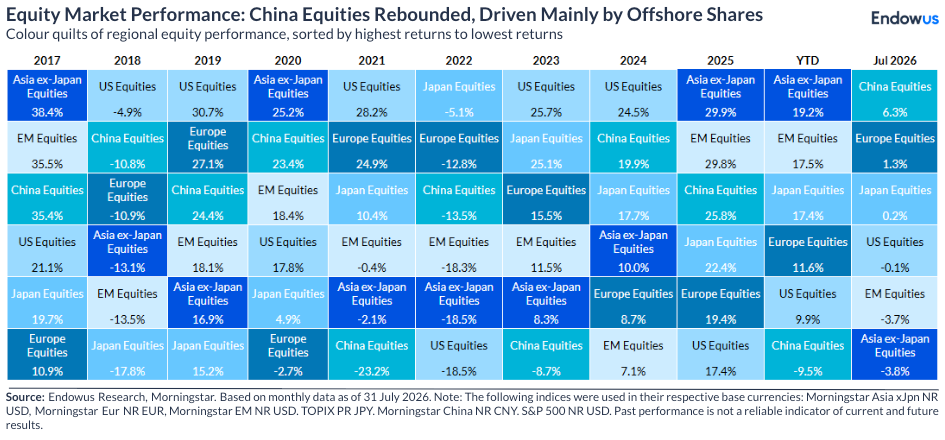
Regional returns were almost entirely a function of which sector dominates the respective markets. Hong Kong-listed Chinese equities, which have low exposure to tech hardware, were one of the best performing regions, while UK and Europe equities also did better than the US thanks to their lower technology weight, heavy exposure to financials and overall global nature of the listed businesses, which helps offset the effect of higher oil prices.
Asia ex Japan was the weakest region, reversing its leadership in the first half of 2026. Unlike the US, where AI exposure sits with hyperscalers and software platforms, it is disproportionately levered to the semiconductor manufacturing supply chain. South Korea and Taiwan fell 16.2% and 7.8% respectively, more than offsetting China’s positive contribution.
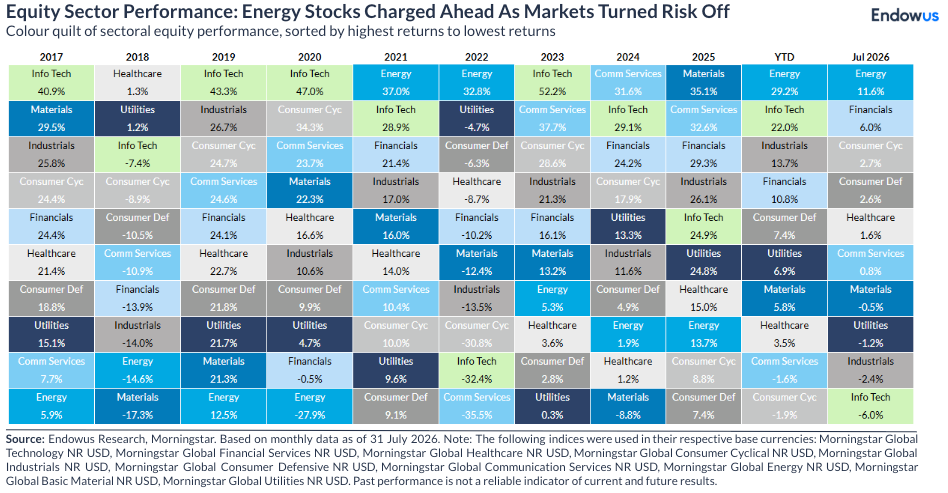
By sector, energy was the clear leader (+11.6%)—as oil moved up—with financials (+6.0%) supported by the rise in yields. Information technology was the worst performer (-6.0%), with industrials (-2.4%) and utilities (-1.2%) also under pressure.
Global fixed income
Fixed income has been front and centre as government bond yields rose broadly across developed markets. Higher energy prices and resilient economic data prompted a hawkish repricing, and although major central banks left policy unchanged, markets began pricing hikes over the next twelve months.
Concerns about debt sustainability and the Fed’s willingness and ability to bring down core inflation pushed investors to sell the long end. The 10-year US Treasury yield ended July at 4.73%, up 27bps on the month, while the 2-year rose 12bps to 4.29%. Longer dated bonds moved furthest: the 30-year closed at 5.27%, a level last seen in 2007, and spent most of July above 5%.
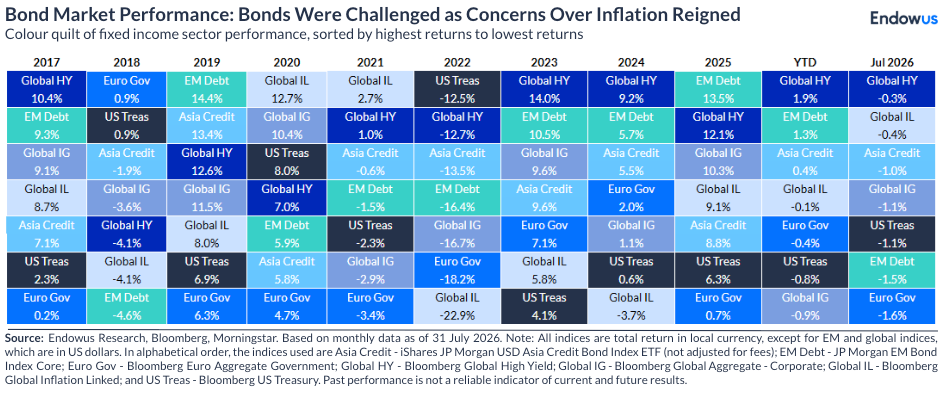
The Bloomberg Global Aggregate fell 1.0% on a USD basis. Performance across sectors was driven by duration rather than credit quality: Global corporate high yield (-0.3%) held up best on shorter duration and higher carry despite spreads widening more than investment grade, while US treasury (-1.1%), EM debt (-1.5%), and EU Govt bonds (-1.6%) lagged. Within investment grade, technology spreads widened relative to the index as hyperscaler debt supply flooded the market.
Commodities
Commodities were the month's best-performing asset class, with BCOM up 7.2%. The resumption of US-Iran hostilities drove Brent from $71.57 on 1 July to $100.69 on 23 July before it settled at approximately $90 at month-end.
Gold was the notable non-participant, closing the month at around $4,046/oz for a gain of 1.0% and leaving it down 6.3% year-to-date. A firmer real yield backdrop and a Fed expected to stay higher for longer continued to offset the inflation impulse. Silver has fared worse still, down 19.6% year-to-date.
Webinar: Travel, market and crypto bubbles
.png)
We are heading into bubble trouble

Endowus 2020 review and 2021 outlook



%20F1(2).webp)

.webp)
.webp)






.webp)