

.webp)
.webp)
.webp)
.webp)


.webp)


%20(1).gif)

Register for the event
Endowus invites you to our exclusive event with Macquarie Asset Management, as we discuss unlocking opportunities in Infrastructure- a $1.3tn asset class.
This event is reserved for Accredited Investors (AIs) only. To register for the event, please indicate one of the following:
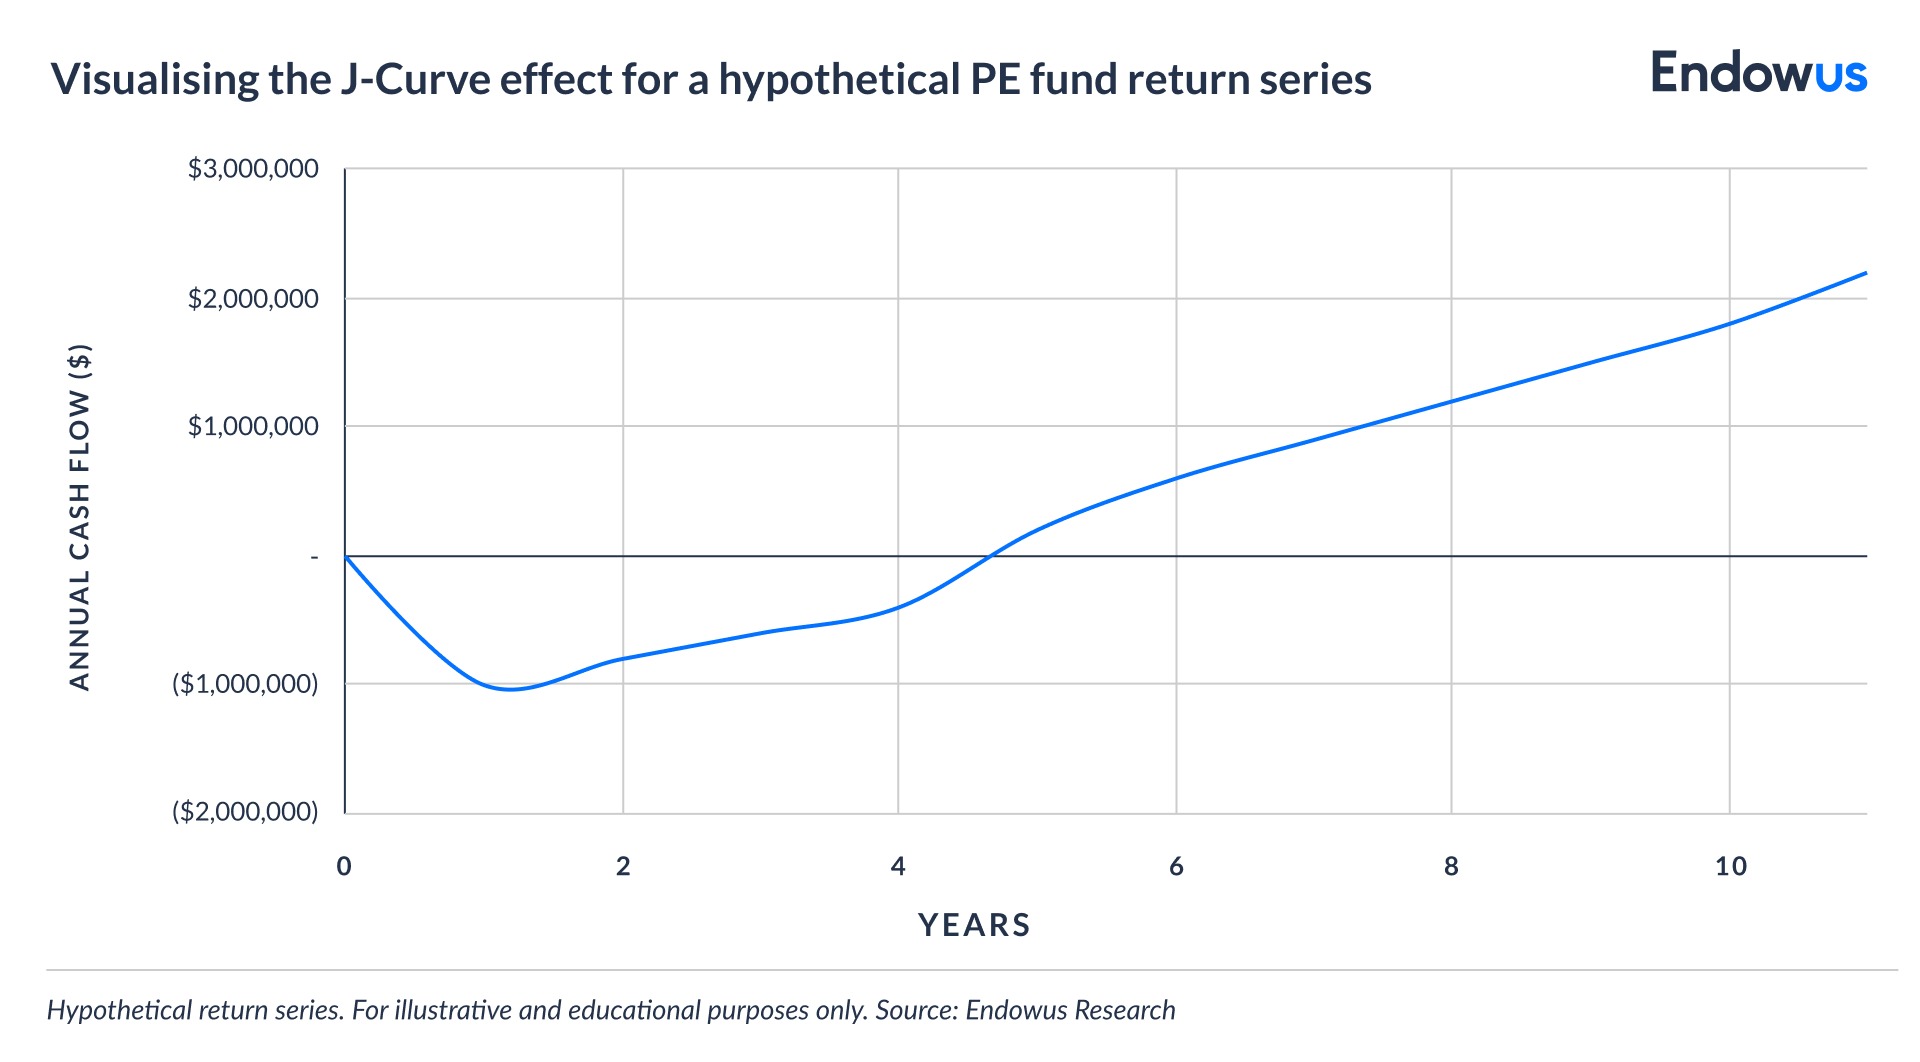
- The J-curve is the visual depiction of a private equity fund's net asset value (NAV) falling in the early years, before eventually rising as portfolio companies mature and returns are realised.
- The dip is not a sign of failure: management fees, investment costs, and unrealised write-downs on new holdings all weigh on early returns, even when underlying assets are performing well.
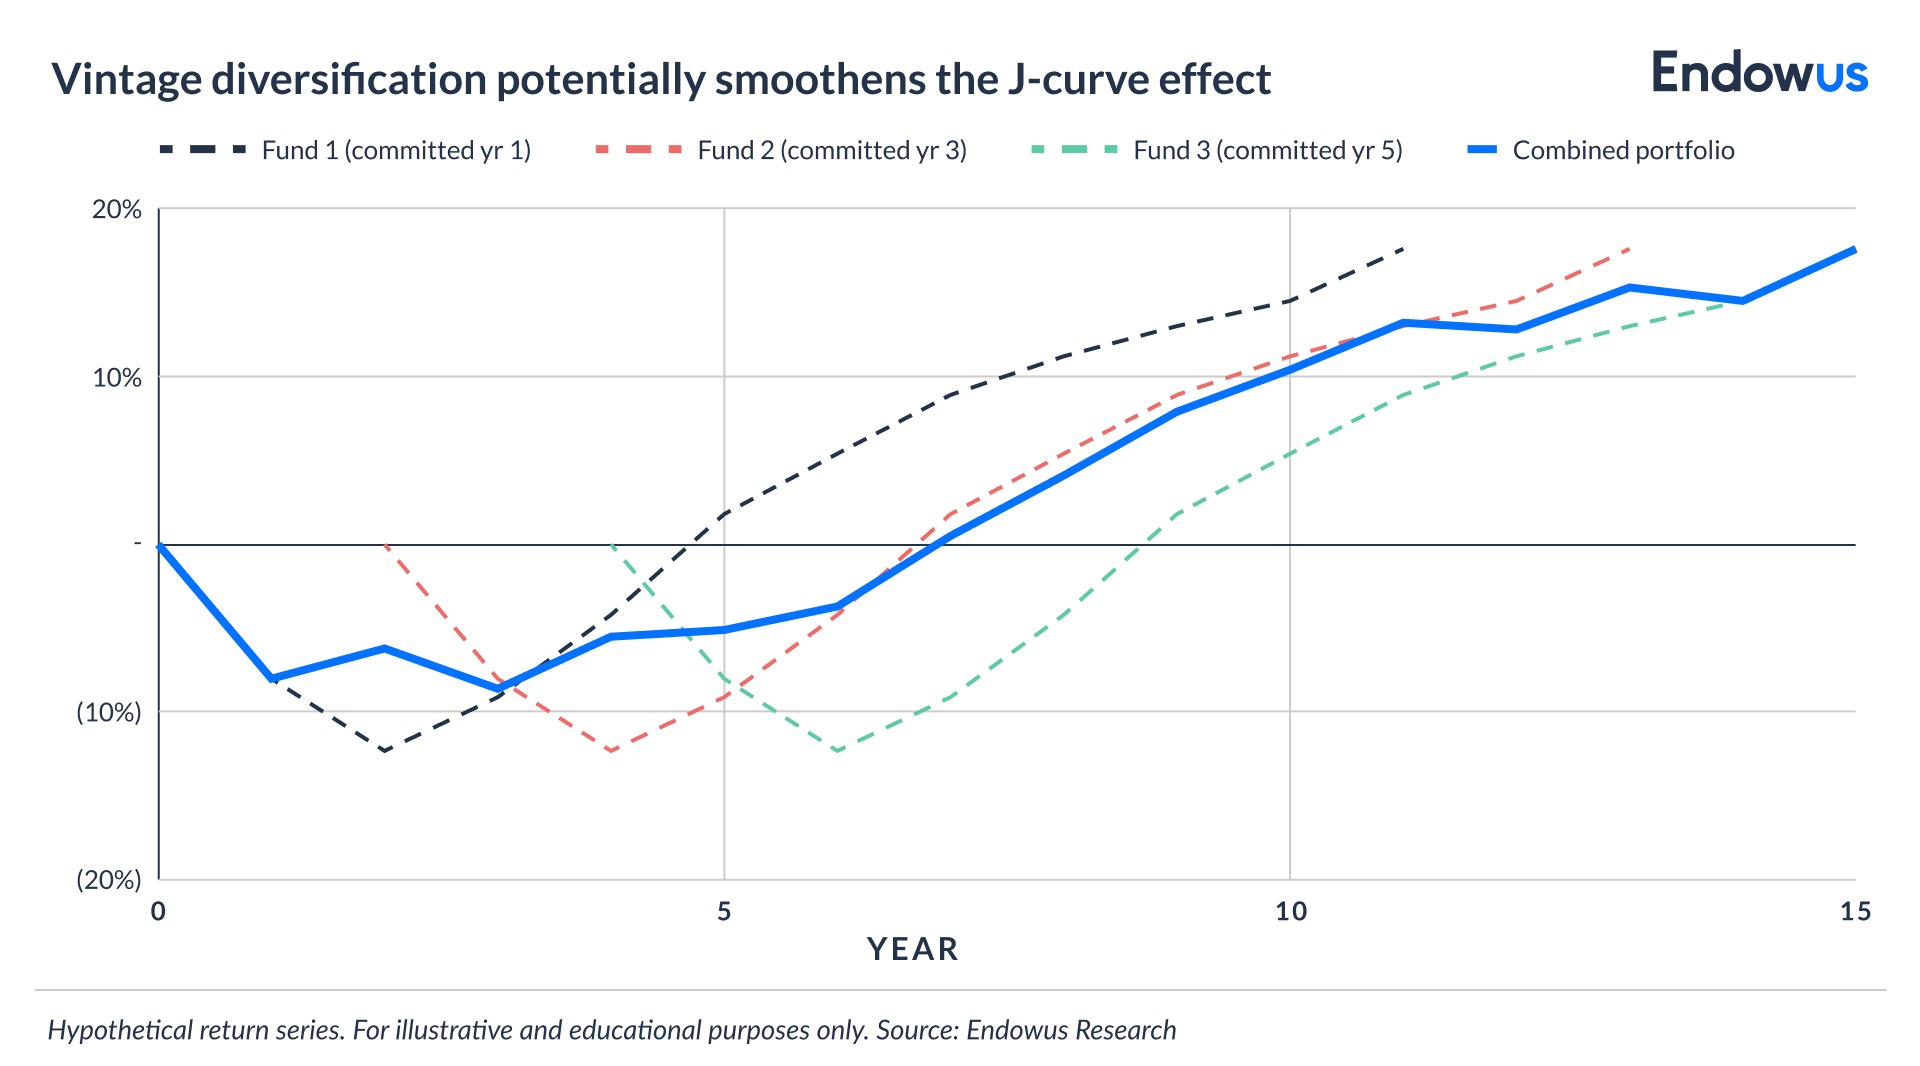
- Investors may mitigate J-curve effects through vintage diversification, secondaries, and co-investments—each of which can help front-load cash flows and smooth the return profile over time.
Anyone who has reviewed an early statement from a private equity fund and found the reported value lower than their original commitment has encountered the J-curve—a feature of private markets investing that needs to be understood before committing capital.
The J-curve is the characteristic return pattern of closed-end private equity funds: a period of negative or flat net returns in the early years, followed by a gradual recovery and, in well-managed funds, potential substantial appreciation as portfolio companies mature and are sold. When plotted over time, cumulative returns trace a shape that resembles the letter J.
This piece explains why PE returns data typically forms a “J” on a chart, how long the dip typically lasts, and what investors may do to reduce the initial downside.
Why does the J-curve effect occur in private equity investing?
The J-curve is a structural feature of closed-end funds. At inception, several forces push early returns into negative territory, regardless of whether the investment decisions are paying off.
- Management fees and fund expenses. From the moment a fund closes, investors begin paying management fees—typically 1.5% to 2% of committed capital per year. These fees reduce the fund's net asset value (NAV) from day one, before a single investment has been made or exited.
- Slow capital deployment. Private equity managers rarely deploy all committed capital immediately. Dry powder—capital committed but not yet invested—earns minimal returns while fees continue to accumulate. It may take two to four years before a fund is fully deployed.
- Conservative early valuations. Accounting standards require newly acquired companies to be initially valued close to cost. As portfolio companies are developed—revenue grows, margins improve, management teams are strengthened—valuations are marked up. But this takes time.
- No distributions yet. The harvest phase, when companies are sold and proceeds returned to investors, typically occurs in years five through ten of a fund's life. In the early years, there are often capital outflows but likely no inflows.
How long does the dip in the J-curve typically last?
While there isn’t a fixed rule, the initial dip in net asset value typically persists for two to four years after a fund's first close. The recovery and appreciation phase—the upswing of the J—typically spans years four through ten years, as portfolio companies are sold and distributions flow back to investors.
The depth and duration of the J-curve vary by strategy. Buyout funds - what we typically call PE funds - tend to have shallower, shorter J-curves than venture capital (VC) funds, because buyout targets typically generate cash flows sooner and are valued using more transparent market comparables. VC funds may experience deeper early dips and require a longer holding period before the upswing materialises.
According to data from Cambridge Associates, the median time to peak drawdown for private equity funds is approximately two to three years from inception. Historical data also shows that top-quartile managers tend to produce shallower J-curves than median managers—a reminder that manager selection matters as much as strategy.
What does the J-curve mean for how investors think about returns?
Investors accustomed to public market reporting—where portfolio values are updated daily—can find the J-curve disorienting. But a fund statement showing a loss in year two does not necessarily mean the fund is underperforming - it may simply reflect the structural mechanics described above.
The relevant metric for investors to assess the performance of a private equity fund in early years should be the quality and trajectory of the underlying portfolio. Experienced investors monitor deployment pace, portfolio company performance, and the manager's ability to source and win deals—not the mark-to-market NAV, which may be temporarily depressed for entirely mechanical reasons.
This is why private equity commitments are typically assessed over the full fund life—ten to twelve years—rather than on an annual basis. The internal rate of return (IRR) and total value to paid-in capital (TVPI) figures reported at fund maturity are a far more meaningful measure of performance than early-year NAV readings.
How can investors reduce the impact of the J-curve?
Several portfolio construction approaches may help mitigate J-curve effects, each with different trade-offs.
Vintage diversification. Committing capital across multiple fund vintages—different year classes—means that while one fund may be in its early dip, others may already be distributing capital. This smooths aggregate cash flows for the end investor and reduces the concentration of early losses in any single period.
Secondary market investments. Secondaries involve purchasing existing fund interests from other investors on the secondary market—typically at a discount to NAV. Because secondary buyers acquire stakes in funds that are already partially deployed and generating value, the J-curve effect is significantly reduced or eliminated. Distributions may begin arriving much earlier in the investment horizon.
Co-investments. Co-investing alongside a fund manager in specific portfolio companies allows investors to gain private equity exposure without paying the same layer of fund-level fees. The absence of a management fee drag reduces the early NAV drawdown, partially flattening the J-curve.
Evergreen and semi-liquid structures. A growing range of private market vehicles—often available to accredited investors—use evergreen or semi-liquid structures that deploy capital continuously and distribute proceeds on an ongoing basis. These structures can reduce J-curve exposure because capital is not sitting idle waiting for deployment.
Is the J-curve a reason to avoid private equity?
In our view, the J-curve is not a reason to avoid private markets—it is a reason to enter them with appropriate expectations and a well-constructed plan.
The characteristics that produce the J-curve—long investment horizons, locked-up capital, gradual realisation—are the same characteristics that allow private equity managers to take on complexity, create operational value, and target returns that are structurally difficult to replicate in public markets. The illiquidity premium exists precisely because these investments require patience.
The table below shows a hypothetical return series from a private equity fund. It is an abstract, mock example that helps understand the pattern of PE returns, although it by no means guarantees that PE funds will behave in such a way.
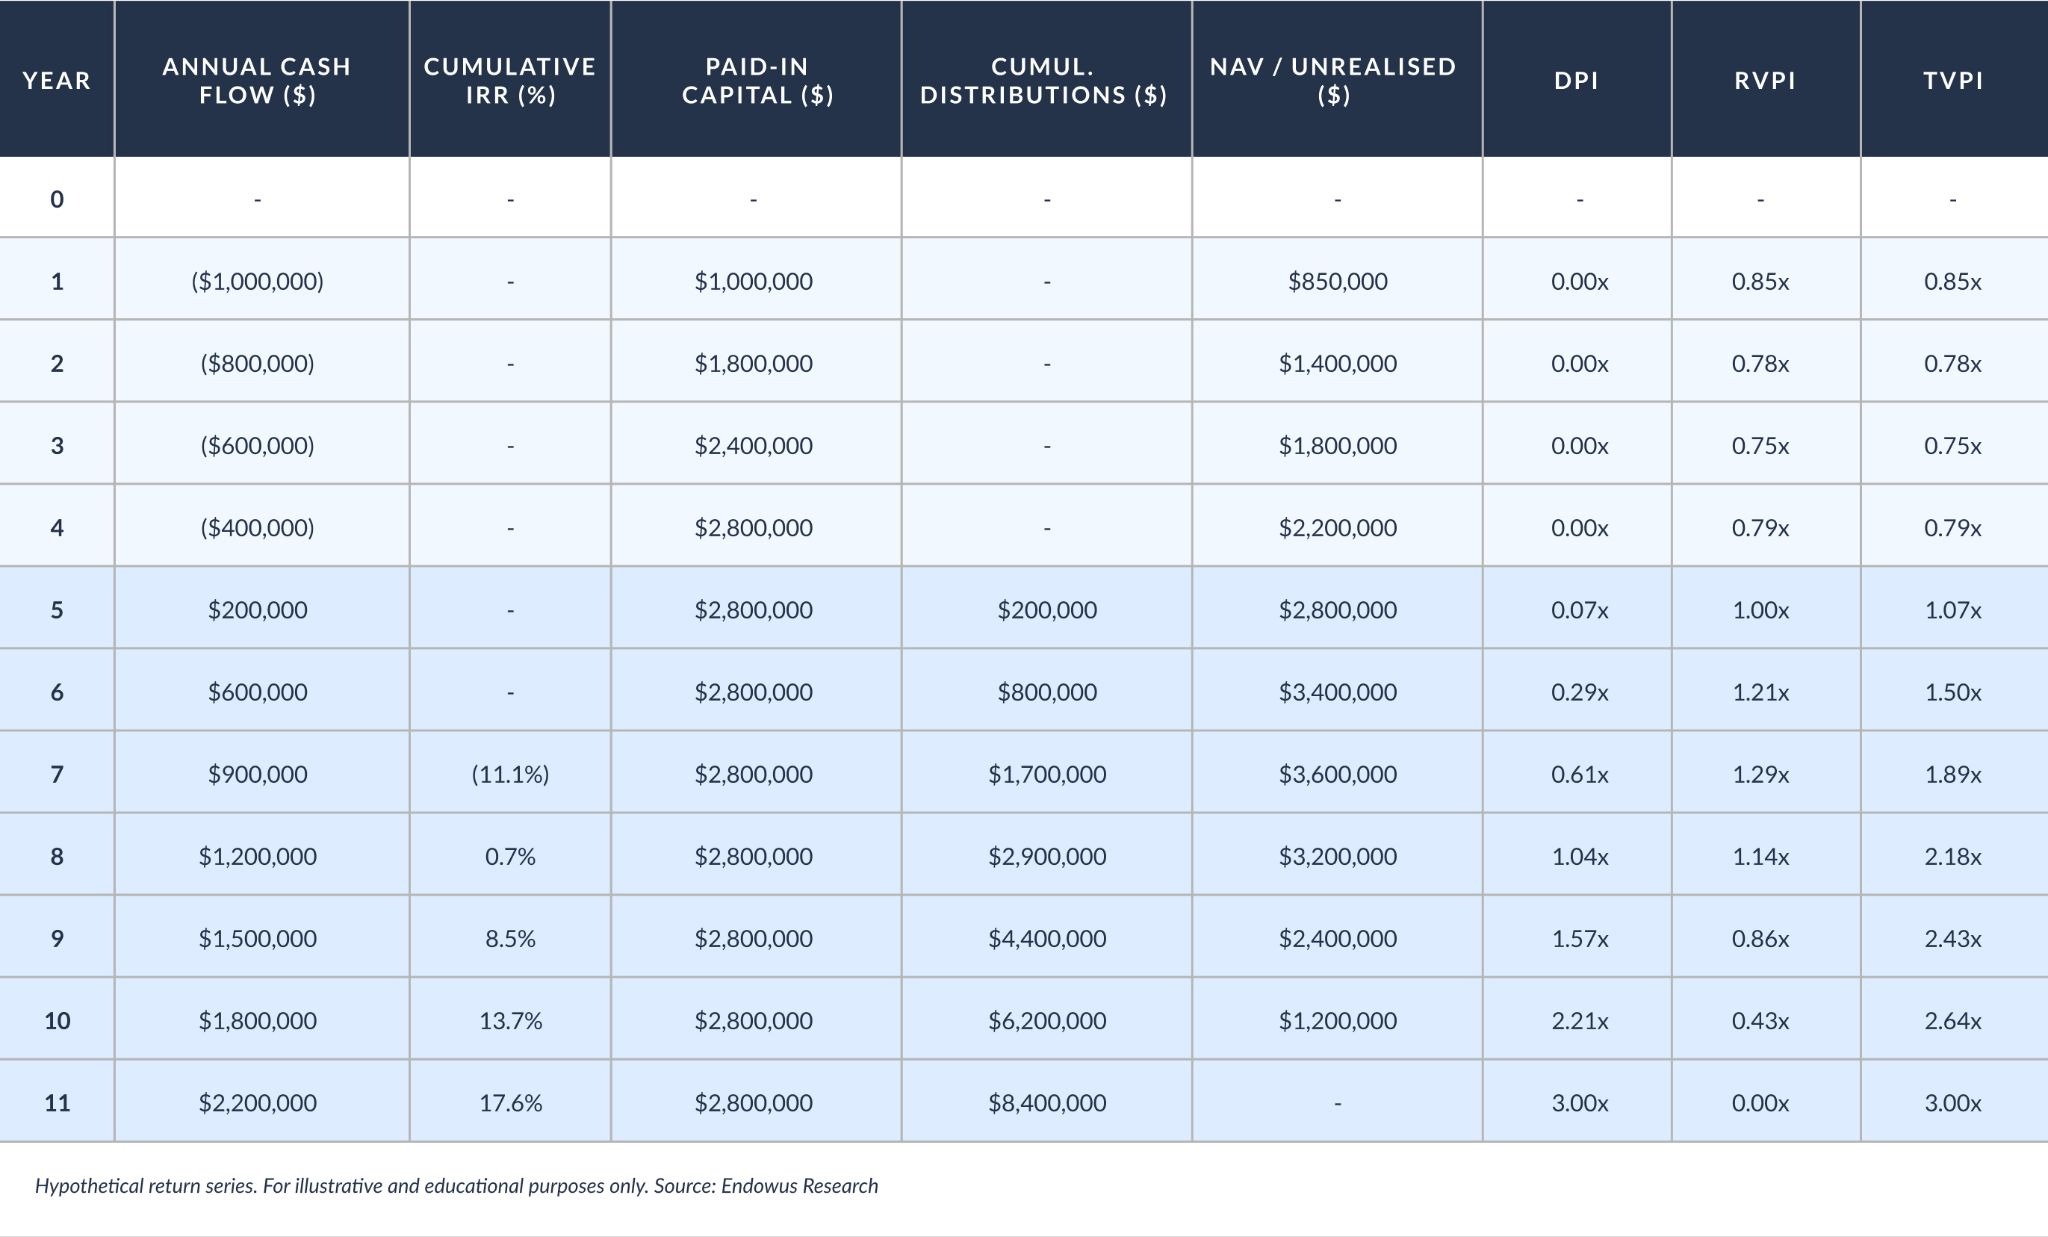
As it can be easily spotted, the early years produce a negative effect on NAV, as the fund incurs in expenses while private companies (which are the investment opportunity set for private equity) are diligenced.
This comes with the territory. Private equity opportunities need to be carefully vetted, term sheets have to be drafted and negotiated, numbers need to be crunched before a strategy is put in place with the goal of increasing the invested companies’ values.
PE investors need to be honest about their liquidity needs before committing capital. Private equity is not suited for short-term, liquid gains. It is suited to long-term portfolios that can absorb the early dip, remain patient through the deployment phase, and allow the upswing to materialise.
Whether PE returns beat public market returns after fees remains a controversial topic within the investment community. Academic research that analyzed PE returns has come to very different conclusions. This widely cited paper from Harris, Jenkinson and Kaplan concluded that outperformance versus the S&P 500 averaged 20–27% over a fund's life and more than 3% annually, and that VC funds outperformed in the 1990s but underperformed in the 2000s. But other more skeptical academics found an average net-of-fees PE fund performance of 3% per year below the S&P 500.
Investment implications: what this means for your portfolio
For investors considering private equity (or venture capital) exposure as part of a broader portfolio, understanding the J-curve has direct practical implications.
First, the allocation should be sized according to their risk appetite, measured against the reality of the private equity return pattern. Given that committed capital earns little in the early years and cannot easily be redeemed, private equity should represent a portion of a long-term portfolio that the investor genuinely does not need to access in the near future.
Second, building gradual exposure may help reduce the initial downside. Staggering commitments across vintages from the outset—rather than making a single large commitment—may potentially decrease the risk of a concentrated J-curve trough. An investor who commits to private equity funds in year one, year three, and year five may find that the early dip of the first fund is partially offset by distributions from the third fund by the time it matures.
Third, secondaries funds, which have been expanding, may offer a more mature entry point to investors seeking private equity exposure with a shorter effective horizon, with less pronounced early-period drawdown.
On the Endowus platform, accredited investors may access a curated range of private market funds across different strategies. Each fund is assessed for manager quality, strategy fit, and risk-adjusted return potential—providing a structured path to building private markets exposure over time.
Frequently asked questions about J-curve
What is the J-curve in investing?
The J-curve is the graphic representation of how a private equity fund's net asset value initially declines before recovering and growing. It reflects the early drag of fees and slow capital deployment, followed by appreciation as portfolio companies mature and are realised.
How long does the J-curve last in private equity?
The early dip typically persists for two to four years. Recovery and the upswing phase usually span years four through ten, depending on the strategy—dips in buyout funds tend to be shorter as VC investments have typically longer time horizons before they reach profitability.
Can the J-curve be avoided entirely?
It cannot be entirely avoided in primary fund investing, but its impact may be reduced through vintage diversification, secondary market investments, co-investments, and evergreen structures that deploy capital on an ongoing basis.
Is a J-curve effect a sign that a fund is underperforming?
Not necessarily. Early NAV declines are often structural—driven by management fees and conservative initial valuations—rather than a reflection of underlying portfolio quality. Performance is better assessed over the full fund life using metrics such as IRR and TVPI.
How does Endowus help investors manage private equity J-curve risk?
Endowus offers accredited investors access to diversified private market portfolios - including primary markets, secondaries and co-investments - allowing investors to build exposure across vintages and structures in a way that manages J-curve effects over time.
How hedge funds can help you ride through market volatility

Is wine a good investment? The liquid illiquid asset

How US private credit can endure downturns
.jpg)


%20F1(2).webp)

.webp)


.webp)