Register for the event
Endowus invites you to our exclusive event with Macquarie Asset Management, as we discuss unlocking opportunities in Infrastructure- a $1.3tn asset class.
This event is reserved for Accredited Investors (AIs) only. To register for the event, please indicate one of the following:
- Singapore’s three local banks made up 59.1% of the Straits Times Index (STI) at 30 September 2026, so a fall in bank shares moves the whole benchmark.
- Market-capitalisation weighting gives more weight to shares that have already risen, so the banks’ rally left the index more dependent on them.
- Singapore is about 0.37% of the FTSE All-World Index (as of 30 September 2026), so the share of a portfolio held locally is a sizing decision that a global benchmark helps frame.
US Treasury yields rose to their highest level since 2002 in early October 2026, and bank shares fell across global markets. Singapore’s three local banks — DBS, Oversea-Chinese Banking Corporation (OCBC), and United Overseas Bank (UOB) — gave back part of this year’s gains. By 16 October, the Straits Times Index (STI) stood 6.7% below its record close of 4 September. The decline preceded third-quarter results, and DBS and OCBC had reported record profits for the second quarter and first half of 2026, respectively.
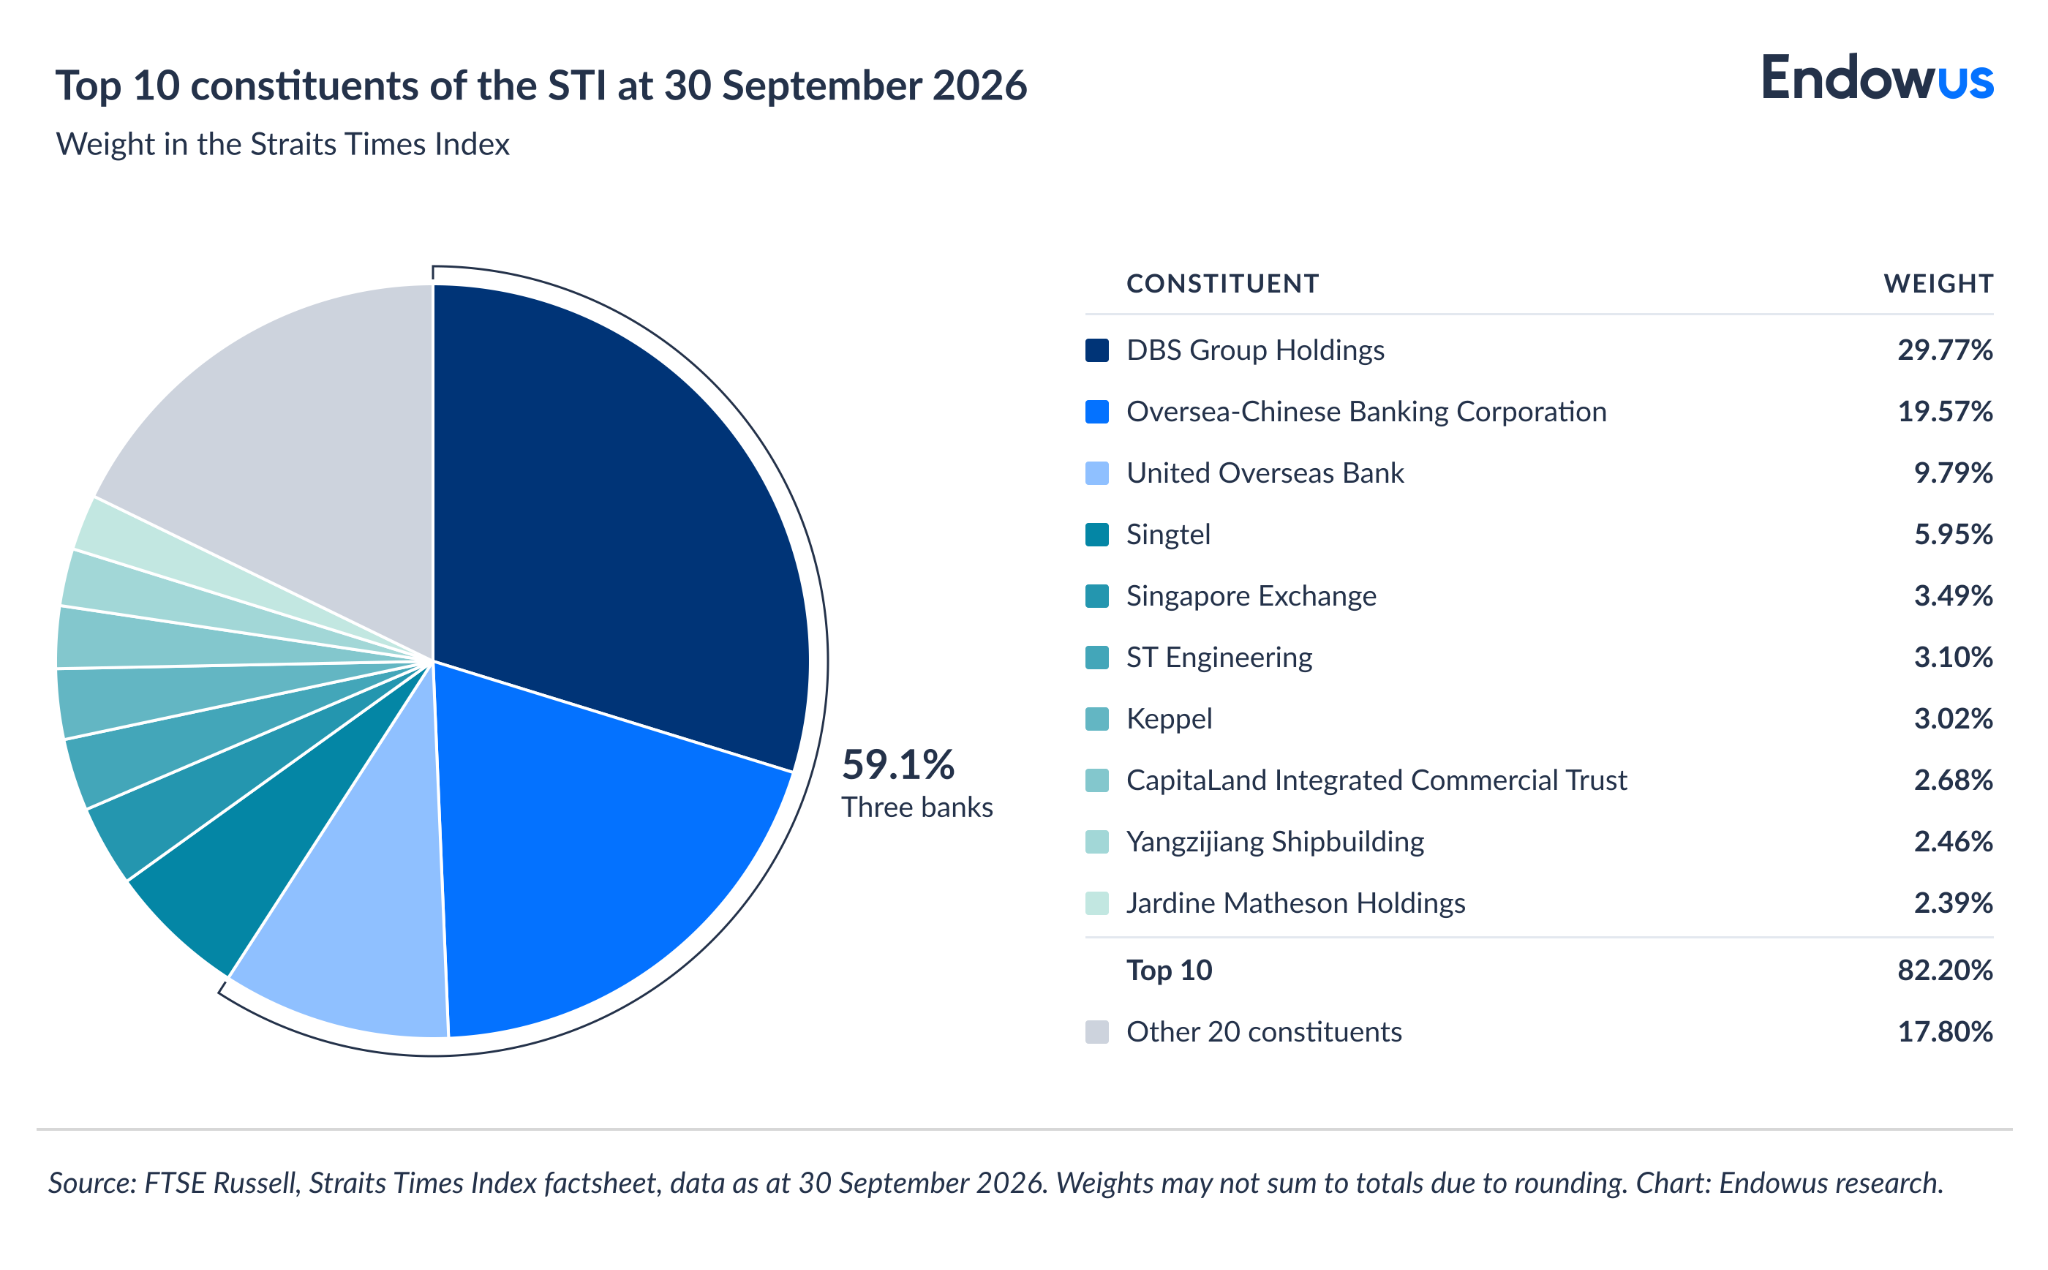
The index pullback shows its high level of concentration in the financial sector, and namely on these three names. As of 30 September 2026, DBS, OCBC, and UOB together accounted for 59.1% of the STI’s weight, so the benchmark tracks their performance closely. “Blue chip” describes the standing of a single company, which means a portfolio anchored on local blue chips holds a large sector position. The useful question is how much of that exposure to keep, measured against a wider global opportunity set.
This article covers how the STI is built, why the banks’ weight has grown, and how the index compares with global benchmarks on breadth, income, and returns.
Few blue chip stocks carry most of the weight in the Straits Times Index
The STI comprises 30 companies listed on the Singapore Exchange (SGX), with an unusual level of concentration in banking stocks. DBS alone made up 29.8% of the index at 30 September 2026, roughly nine times the 3.3% it would hold under equal weighting. OCBC (19.6%) and UOB (9.8%) ranked second and third. Adding SGX itself, four financial stocks carried 62.6% of the index.
The 10 largest holdings accounted for 82.2% of the index, which left the other 20 stocks to share 17.8%. Real estate ranked second among sectors at 12.6% across 12 stocks.
The banks’ weight grew because the weighting method follows share prices
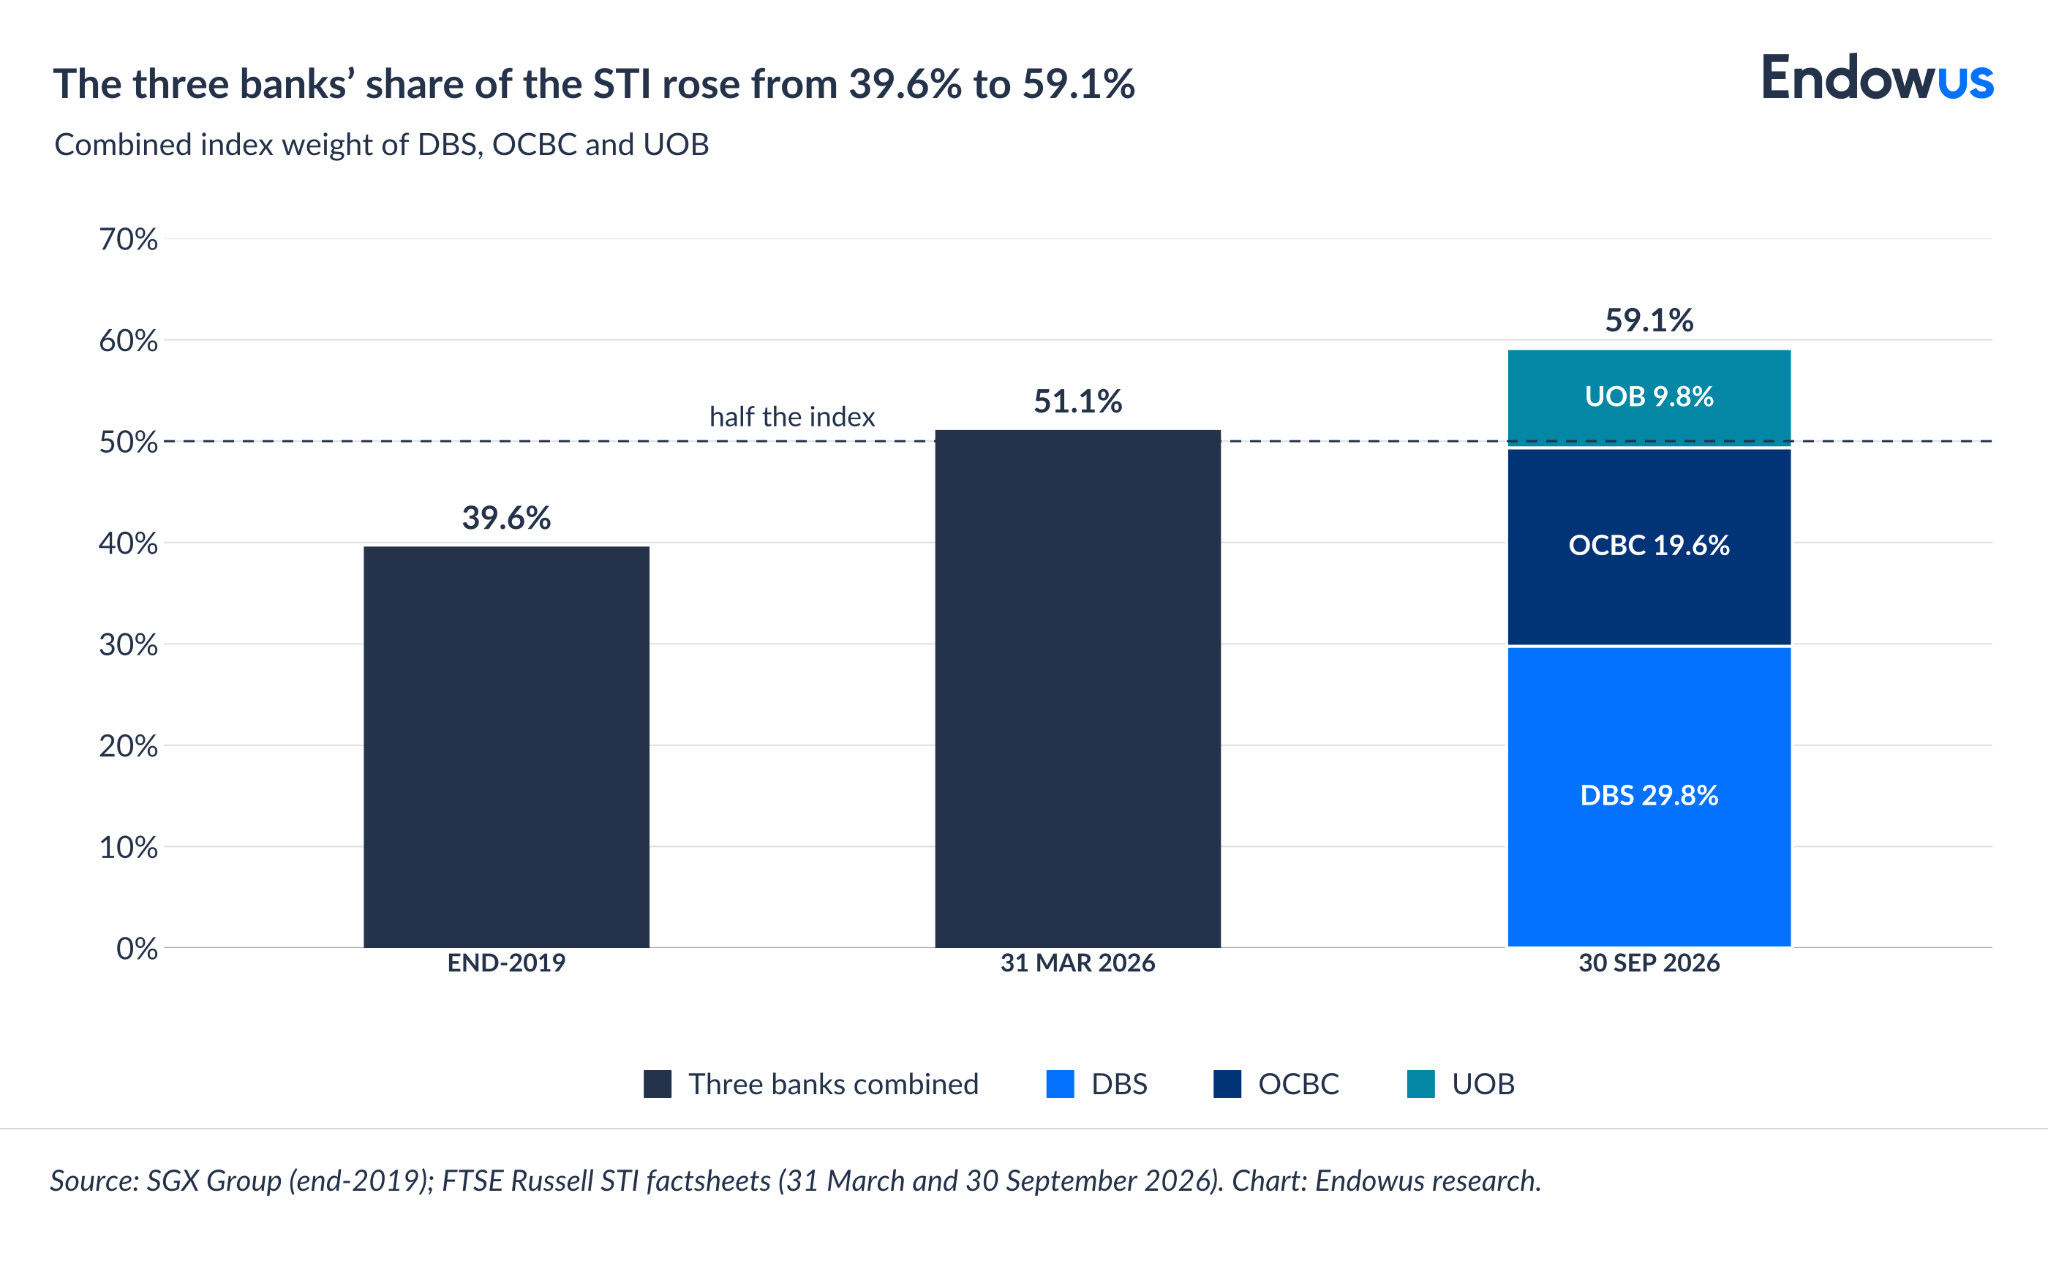
The STI weights each company by market capitalisation, so a stock’s share of the index rises when its price outpaces the rest of the market. The three banks’ combined weight grew from 39.6% in 2019 to 51.1% at 31 March 2026, then to 59.1% at 30 September 2026.
Earnings supported the rise. DBS reported a record net profit of S$3.08 billion for the second quarter of 2026, and OCBC reported a record S$4.19 billion for the first half. The index’s total return year-to-date (as of 30 September 2026) was 26.5%, and each gain in the banks’ share prices lifted their share of the index. Past performance is not necessarily a guide to future performance or returns, and the mechanism can also work in reverse.
Margins have narrowed. Net interest margin, the gap between what banks earn on assets and pay on funding, fell at both banks over the year. DBS reported 1.87% for the second quarter, down 0.18 percentage points, and OCBC reported 1.70%, down 0.22 percentage points. Even so, the index remained above its level at the start of 2026 after the pullback.
Why Singapore investors should look beyond blue chip stocks
Global benchmarks spread the same capital across far more companies and markets
The chart compares the STI with the FTSE Developed Index, which covers 1,904 companies in 26 developed markets, and the FTSE All-World Index, which adds emerging markets for 4,204 companies in 49 markets.
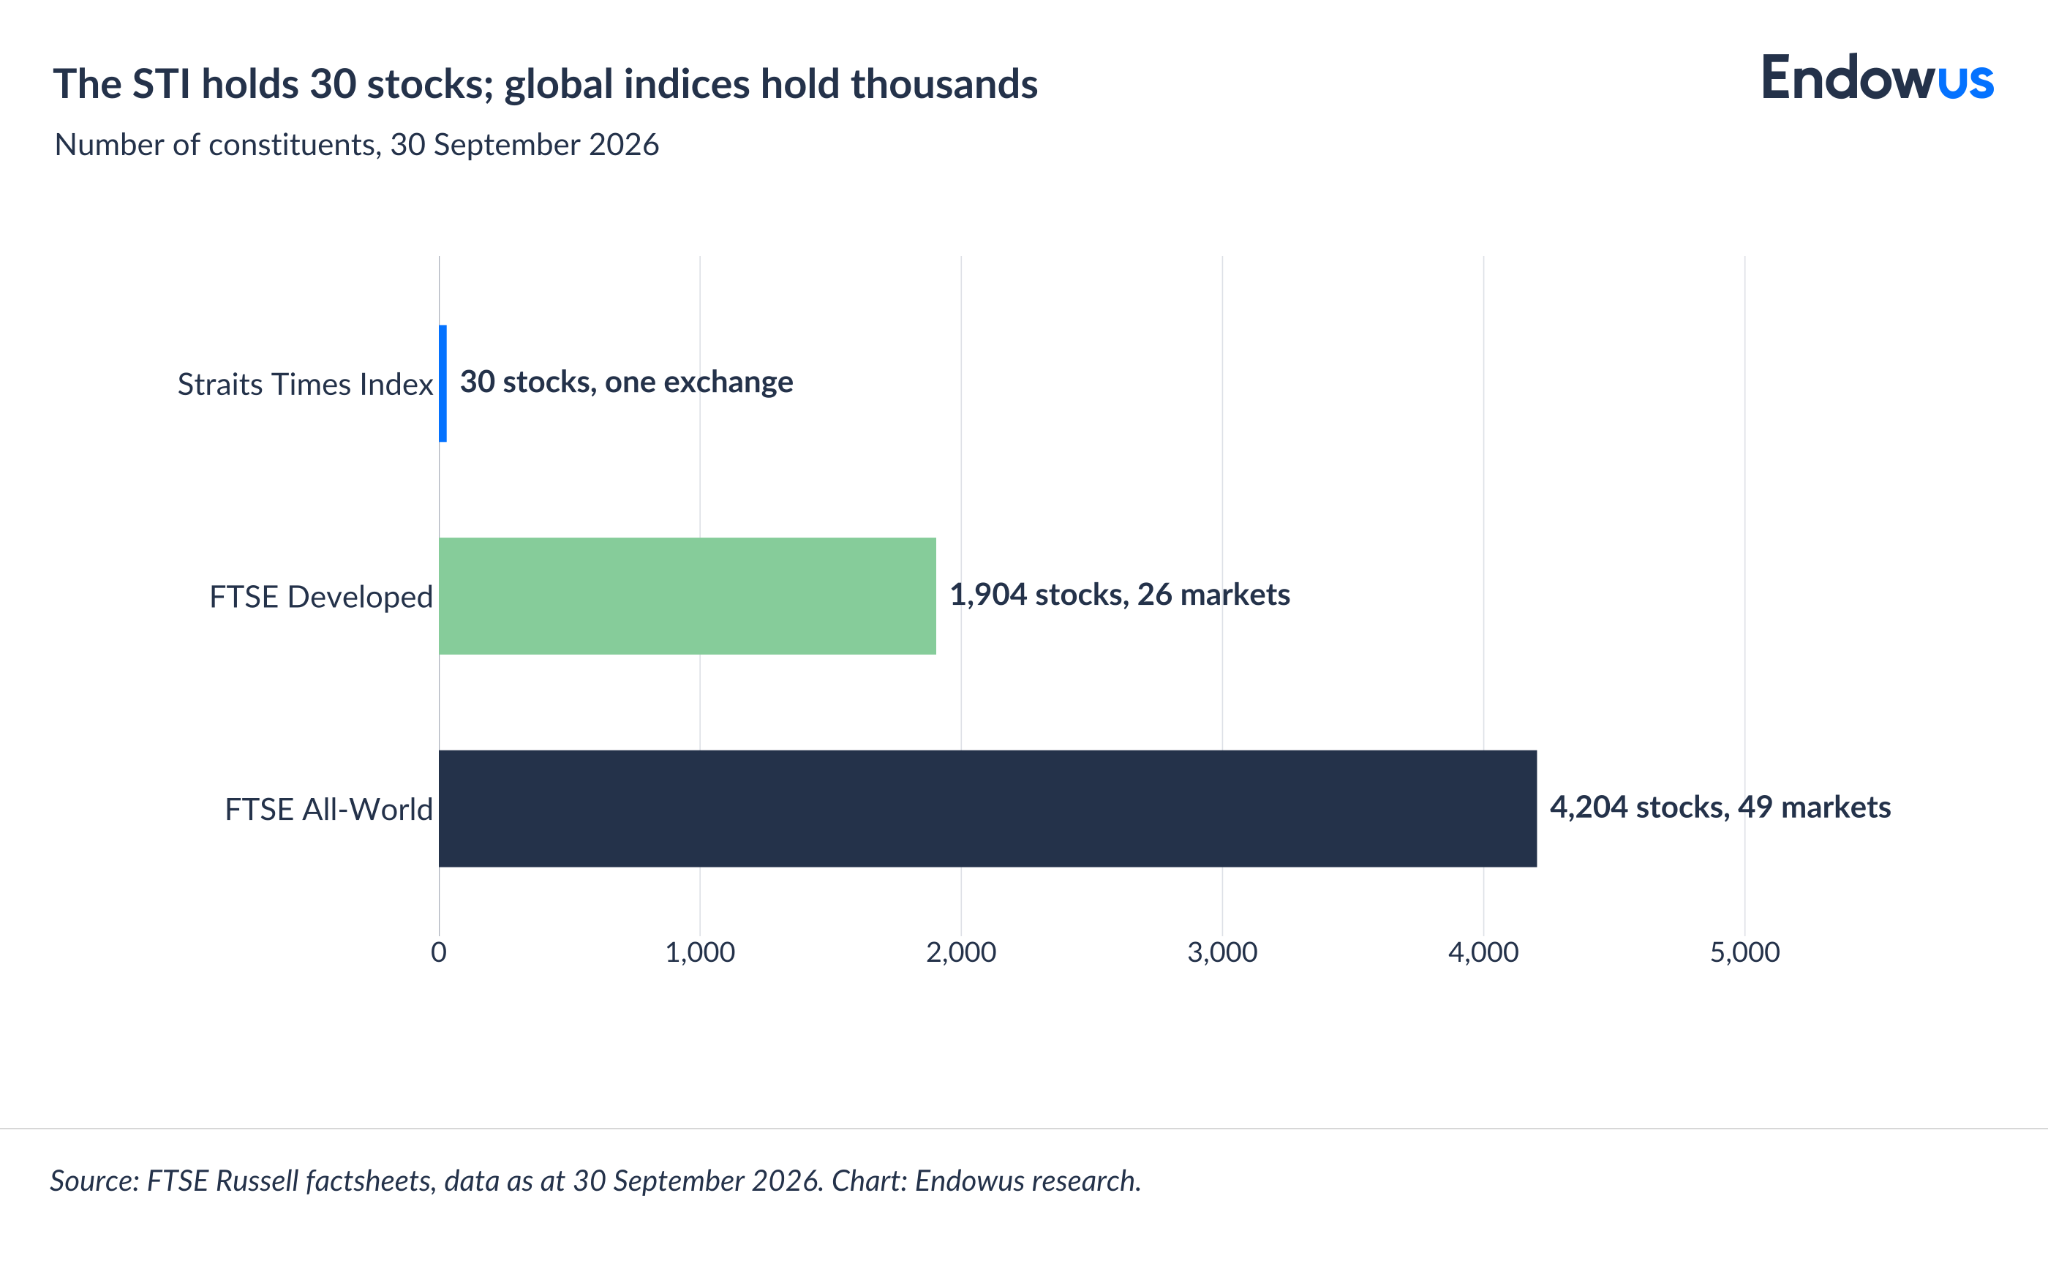
The chart below shows the STI’s three largest holdings carry about four and a half times the weight of the FTSE All-World’s three largest (59.1% against 13.2%). Its largest holding is five to six times the size of the largest in either global index.
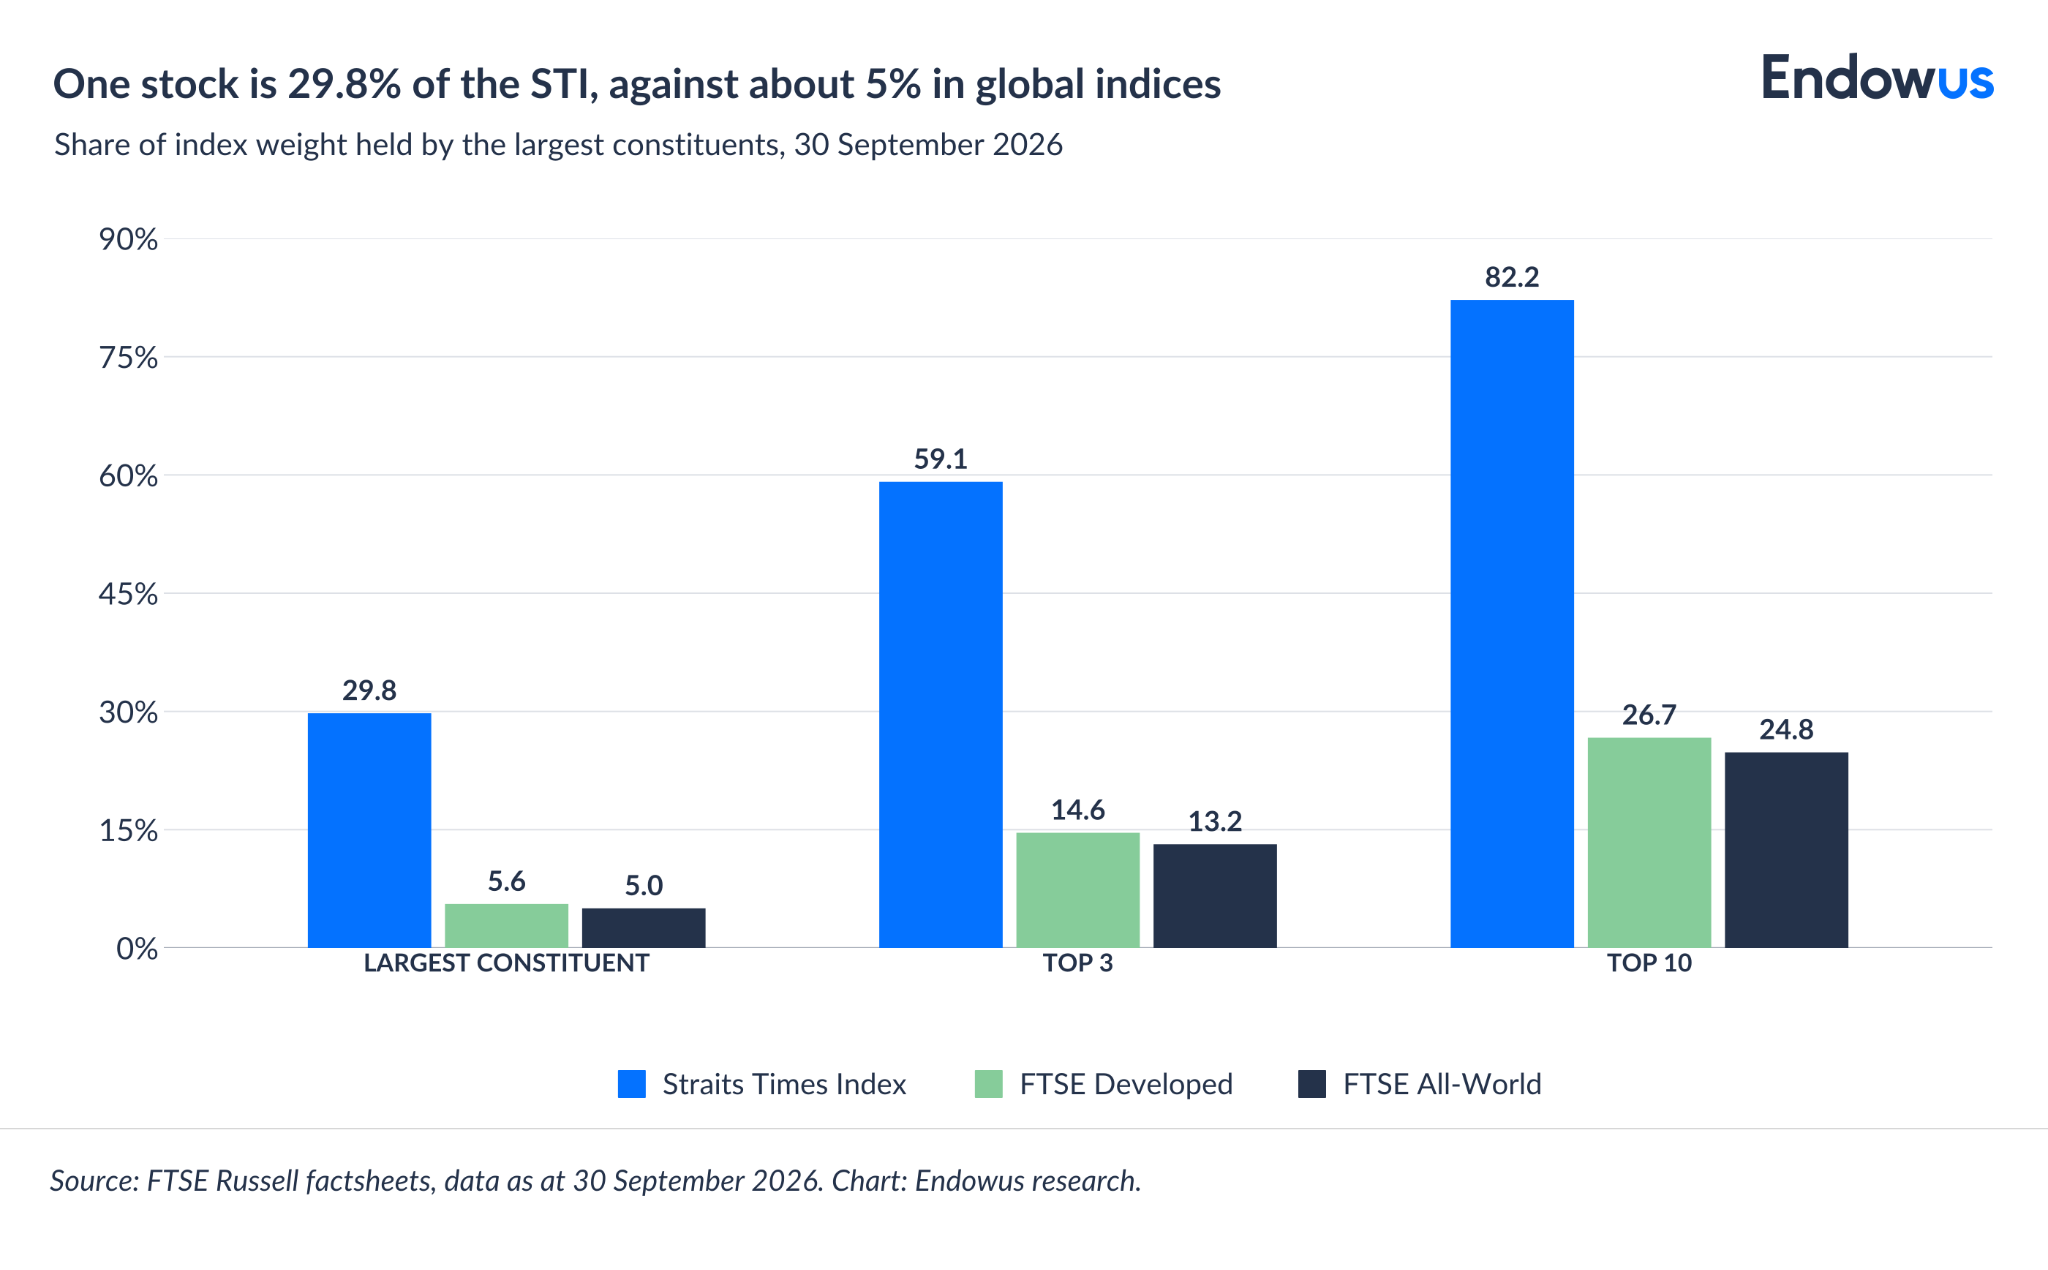
Global indices carry tilts of their own. The United States accounts for 62.3% of the FTSE All-World Index at 30 September 2026, and technology is its largest industry at 36.1% (from the index’s 30 September 2026’s Factsheet). So while a global benchmark spreads risk across far more companies, country and sector tilt remains.
A local blue chip-only equity holding sits far from Singapore’s weight in global markets
Singapore accounts for about 0.37% of the FTSE All-World Index (from the index’s 30 September 2026’s Factsheet), which means there is a sizable difference in positioning for investors who diversify their equity exposure versus the ones that exclusively allocate to Singapore stocks.
Recent flows show continued demand for STI-tracking funds. SGX reported that September 2026 was a record month for STI ETFs, with S$293 million of net creations lifting combined assets above S$6 billion for the first time.
Home-market preference has practical foundations: investors spend in Singapore dollars, know the companies, and receive local dividends. But excessive concentration can increase portfolio volatility.
The STI’s income rests on the same few blue chip payers
Investors often hold local blue chips for dividends. The STI’s trailing dividend yield was 4.65% as of 30 September 2026, against 1.50% for the FTSE Developed Index and 1.59% for the FTSE All-World Index. All three yields are published by FTSE Russell.
In fact, the STI’s higher yield comes from a narrow base. Because three banks carry more than half of the index’s weight, their dividend decisions heavily influence the index’s income. Companies set dividends at their discretion, and payments may change.
A global equity portfolio draws income from thousands of companies across many sectors and markets, at a lower starting yield. The trade-off runs between a higher yield from a narrow base and a lower yield from a broad one, and neither is superior in the abstract.
How do Singapore stock returns compare to that of a global index?
Over the 10 calendar years from 2016 to 2025, the FTSE All-World Index returned 11.2% a year in Singapore dollars, against 9.4% for the STI. The STI led over shorter windows: 26.8% a year over the three years to 30 September 2026 and 18.3% over five, against 19.5% and 10.7%. Past performance is not necessarily a guide to future performance or returns.
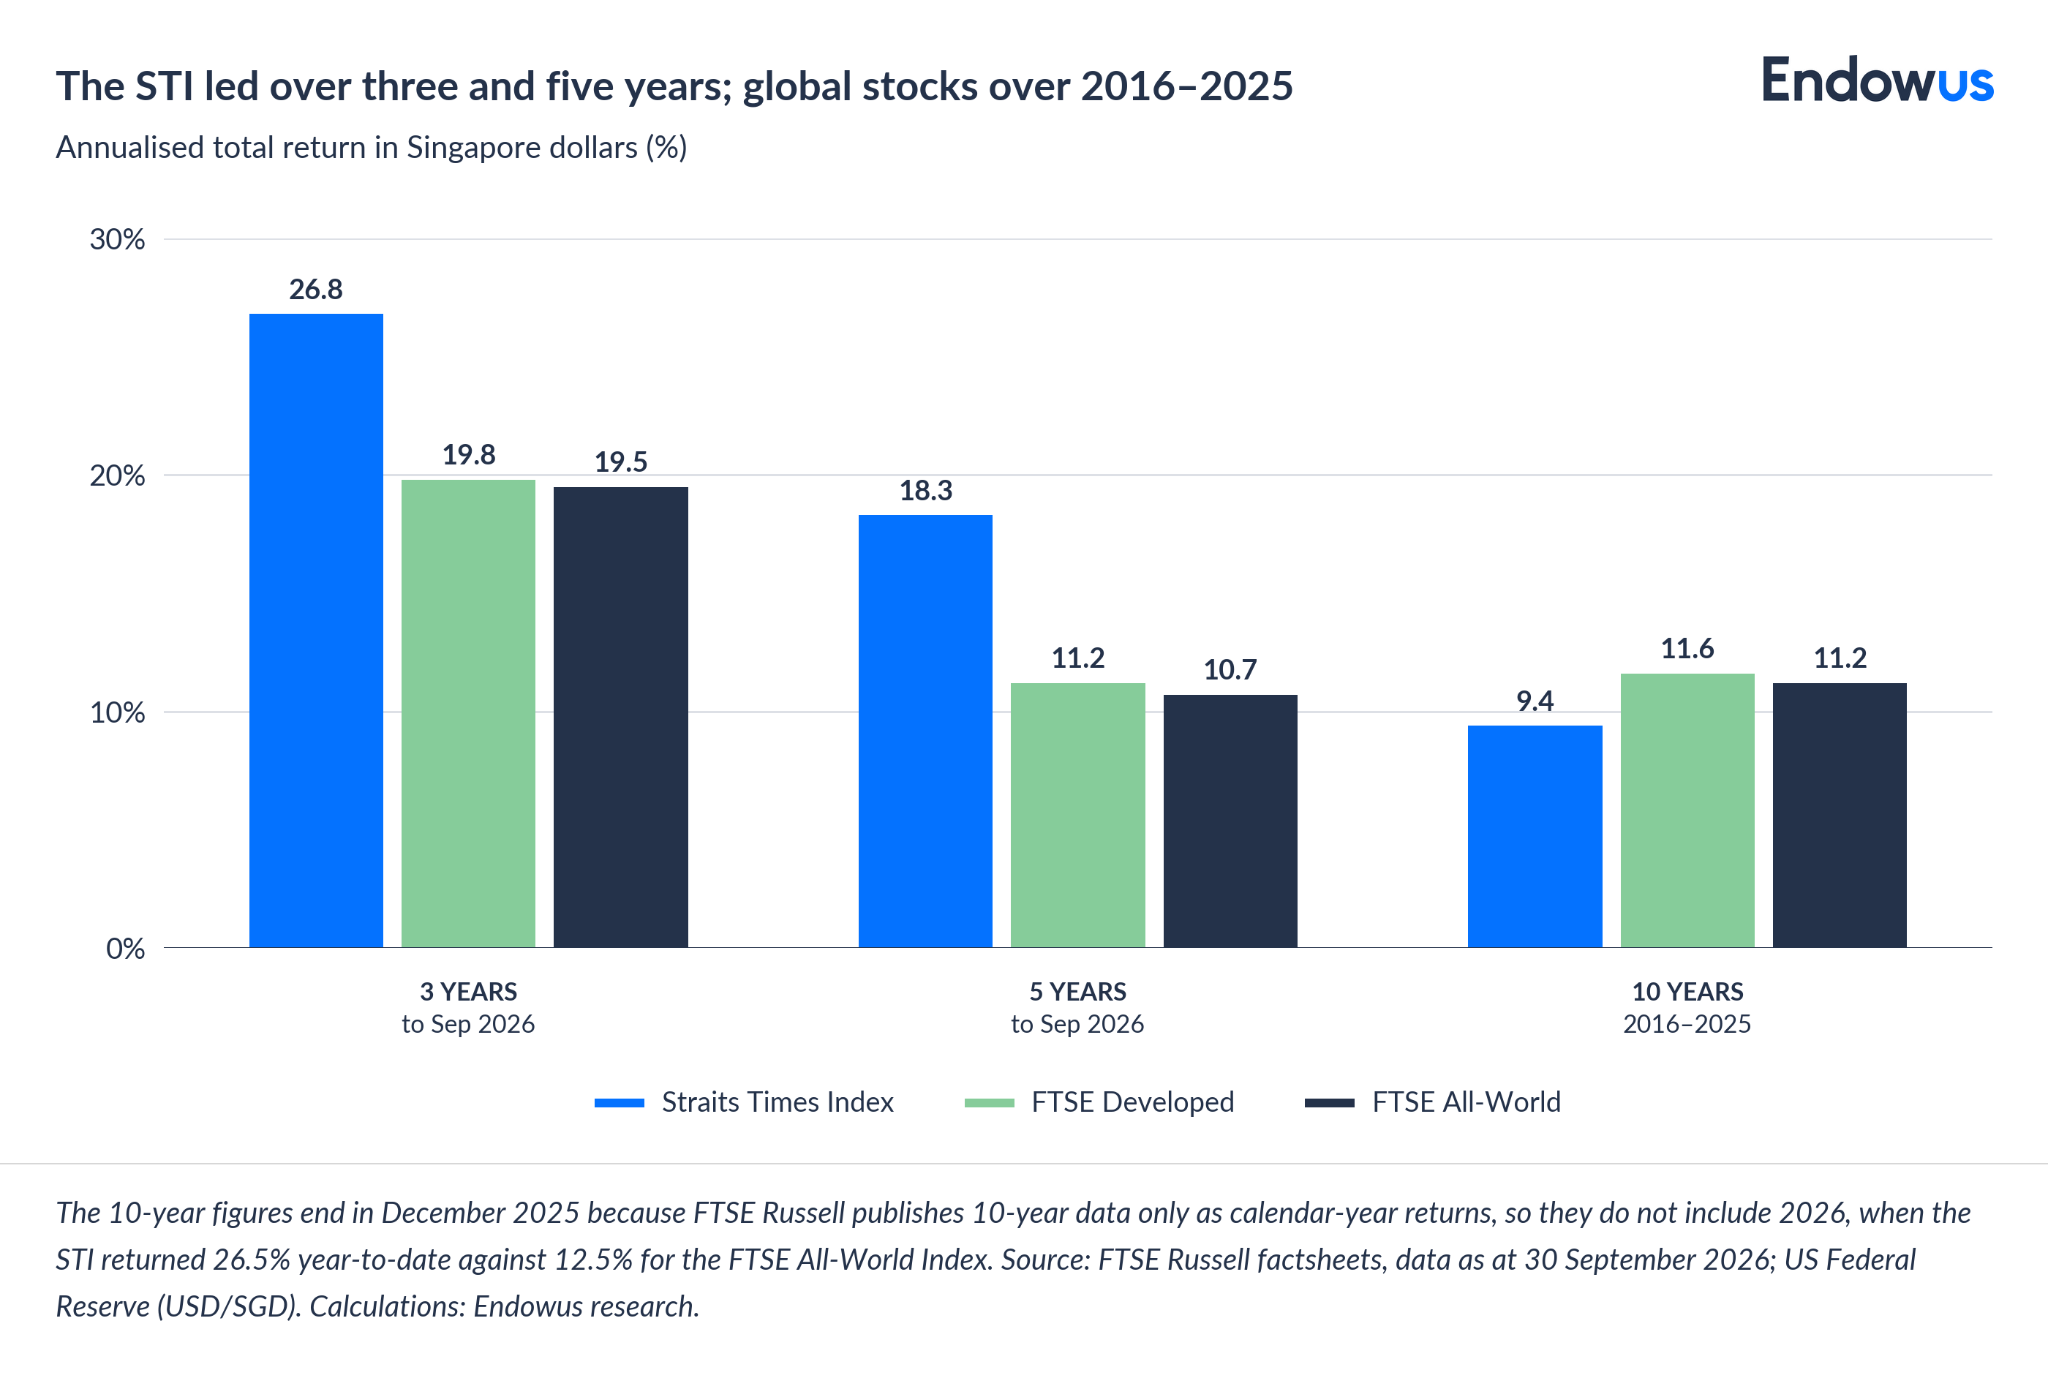
STI returns are FTSE Russell’s Singapore-dollar figures. The FTSE All-World Index returned 12.2% a year in US dollars over the 10 calendar years from 2016 to 2025, and 11.2% a year in Singapore dollars, based on FTSE Russell’s calendar-year returns compounded and converted by Endowus. .
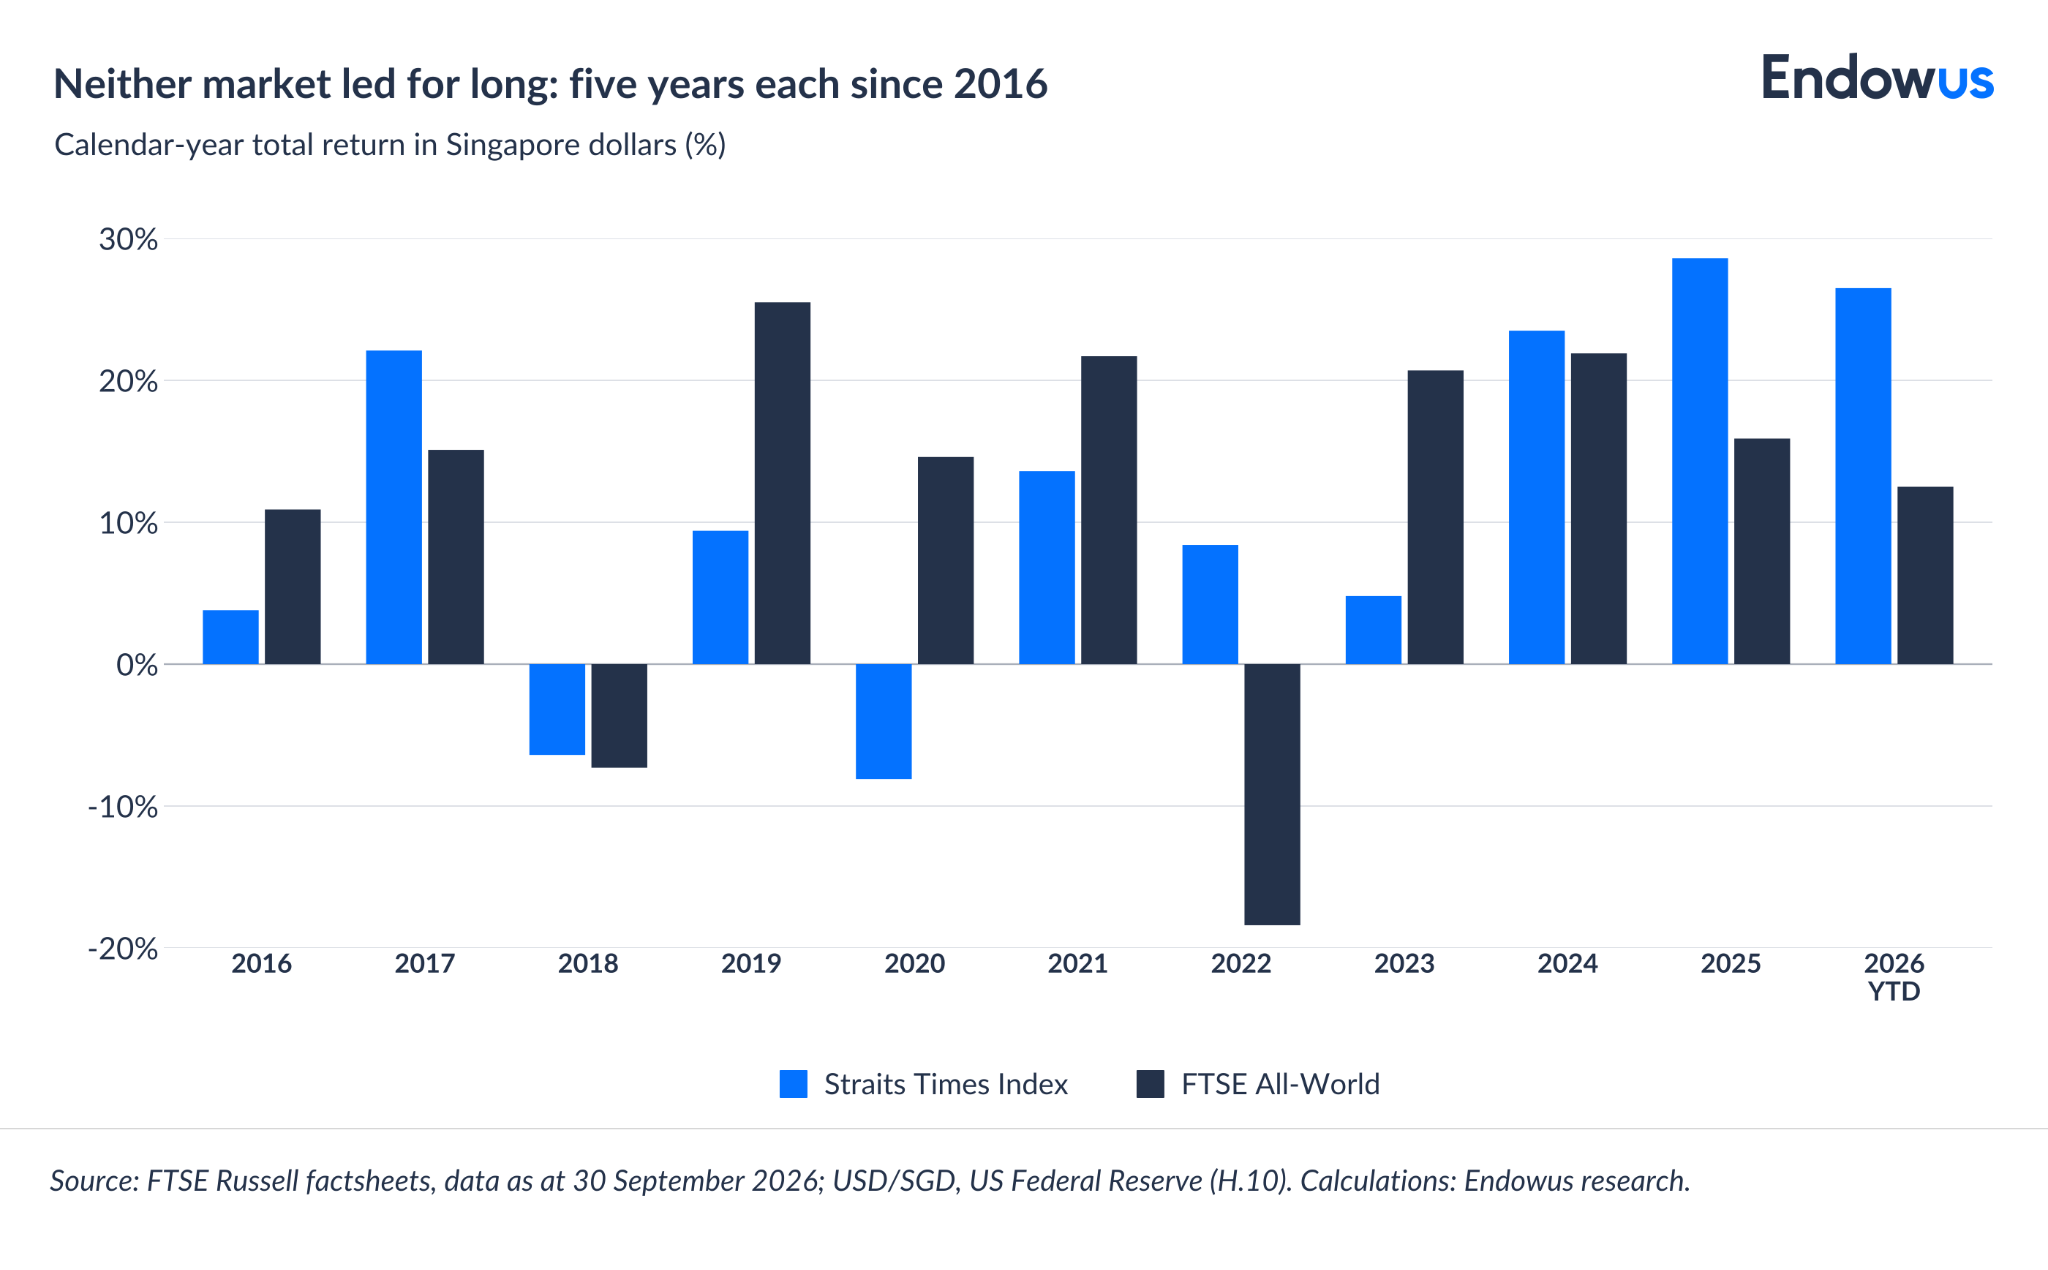
An additional argument is that global may perform better than local equities in specific timeframes, and vice versa. Performance leadership shifts, which is an additional argument in support of diversification.
Should blue chip stocks be included in a diversified exposure
Market-capitalisation weighting pulls an index toward its recent winners, so a holding in the STI may continue to drift toward the three major banks (the “blue chip”) as they rise in price. A target weight for the home market set below 100%, tweaked through periodic rebalancing, may offset that drift.
In our view, Singapore blue chip stocks are better treated as a deliberately sized allocation within a globally diversified portfolio. STI ownership, as we’ve seen, may not provide sufficient diversification. The local banks have reported record profits, and a home allocation has practical advantages for investors who spend in Singapore dollars. But a wider opportunity set may reduce the dependence on a single sector or a handful of companies. As the data above shows, market leadership can change over time.
For investors on Endowus, our advisers can help you determine how much Singapore equity exposure suits your goals, time horizon, and risk profile.
Frequently asked questions
What is a blue chip stock in Singapore?
“Blue chip” is an informal term for large, established, and liquid companies. In Singapore it usually refers to the 30 constituents of the STI, which range from the three local banks to Singtel, ST Engineering, and real estate investment trusts.
Which sectors make up the Straits Times Index?
As of 30 September 2026, financials made up 62.6% of the STI, real estate 12.6%, industrials 8.8%, telecommunications 6.0%, utilities 4.0%, consumer discretionary 3.3%, consumer staples 2.0%, and technology 0.8%. The index held no health care, energy, or basic-materials companies.
How often do STI weights change?
Weights move every trading day with share prices, because the index weights each company by market value. The figures in this article are as at 30 September 2026 and may differ from current weights. FTSE Russell publishes factsheets with updated index weights.
Does a global equity fund still hold Singapore stocks?
Yes. Singapore is a small part of global indices, so a global fund holds Singapore companies, including the local banks, at much smaller weights than the STI does.
Retiring with a bucketing strategy

Webinar: Wealth — the wellness trend for women

Sparking joy: How to Marie Kondo your finances