


.webp)
.webp)
.webp)
.webp)






.webp)












%20(1).gif)

Register for the event
Endowus invites you to our exclusive event with Macquarie Asset Management, as we discuss unlocking opportunities in Infrastructure- a $1.3tn asset class.
This event is reserved for Accredited Investors (AIs) only. To register for the event, please indicate one of the following:
- Market capitalisation is a company’s share price multiplied by its shares outstanding — but it is also the rule that decides how much of each company a broad index fund holds. If you are invested in that index, the largest companies automatically become your largest positions.
- The lines between small-, mid- and large-cap are not standardised: index providers and brokers draw them by different methods. In addition, acompany classed as small-cap in the United States can rank among the larger names on the Singapore market.
- A broad index fund mirrors its index. If the index is diversified across hundreds of companies yet concentrated in a handful of the largest, the index fund will also be.
A single company, Nvidia, was 7.5% of the S&P 500 at the end of June 2026 — a larger share of the index than any single stock has held in decades. Investors who bought into index funds replicating the S&P 500 ended up with a lower level of diversification than they anticipated.
Market capitalisation is not only a measure of a company’s size. It most importantly decides how much of each company a broad index fund (which tracks the index’s exposure) holds — which means anyone who owns one is already “long” (financial jargon for “owning”) large caps. This is key information for investors. According to the Fama-French model, one of the investable “factors” is size - and small caps outperform large caps in the long run.
This article sets out what market capitalisation is, how the small-, mid- and large-cap boundaries are drawn and by whom, why market-cap weighting concentrates a portfolio by construction, and how to read what you actually hold from a fund factsheet.
What market cap is — and the two things it is not
Market capitalisation is fairly straightforward to calculate (share price multiplied by the number of shares outstanding - a company with 500 million shares trading at S$20 has a market capitalisation of S$10 billion) but its function is often misunderstood.
The first mistake is believing that market cap is what someone would pay to buy the company outright. It is not: that figure is enterprise value, which adds the company’s debt and subtracts its cash, because a buyer inherits both. A business with a S$10 billion market cap and S$3 billion of net debt costs S$13 billion to take over. The second misreading is that market cap measures the money invested in the business, or the value of its assets. It measures neither. It is a price set by today’s buyers and sellers, and it moves every time the share price does, while the company underneath is unchanged.
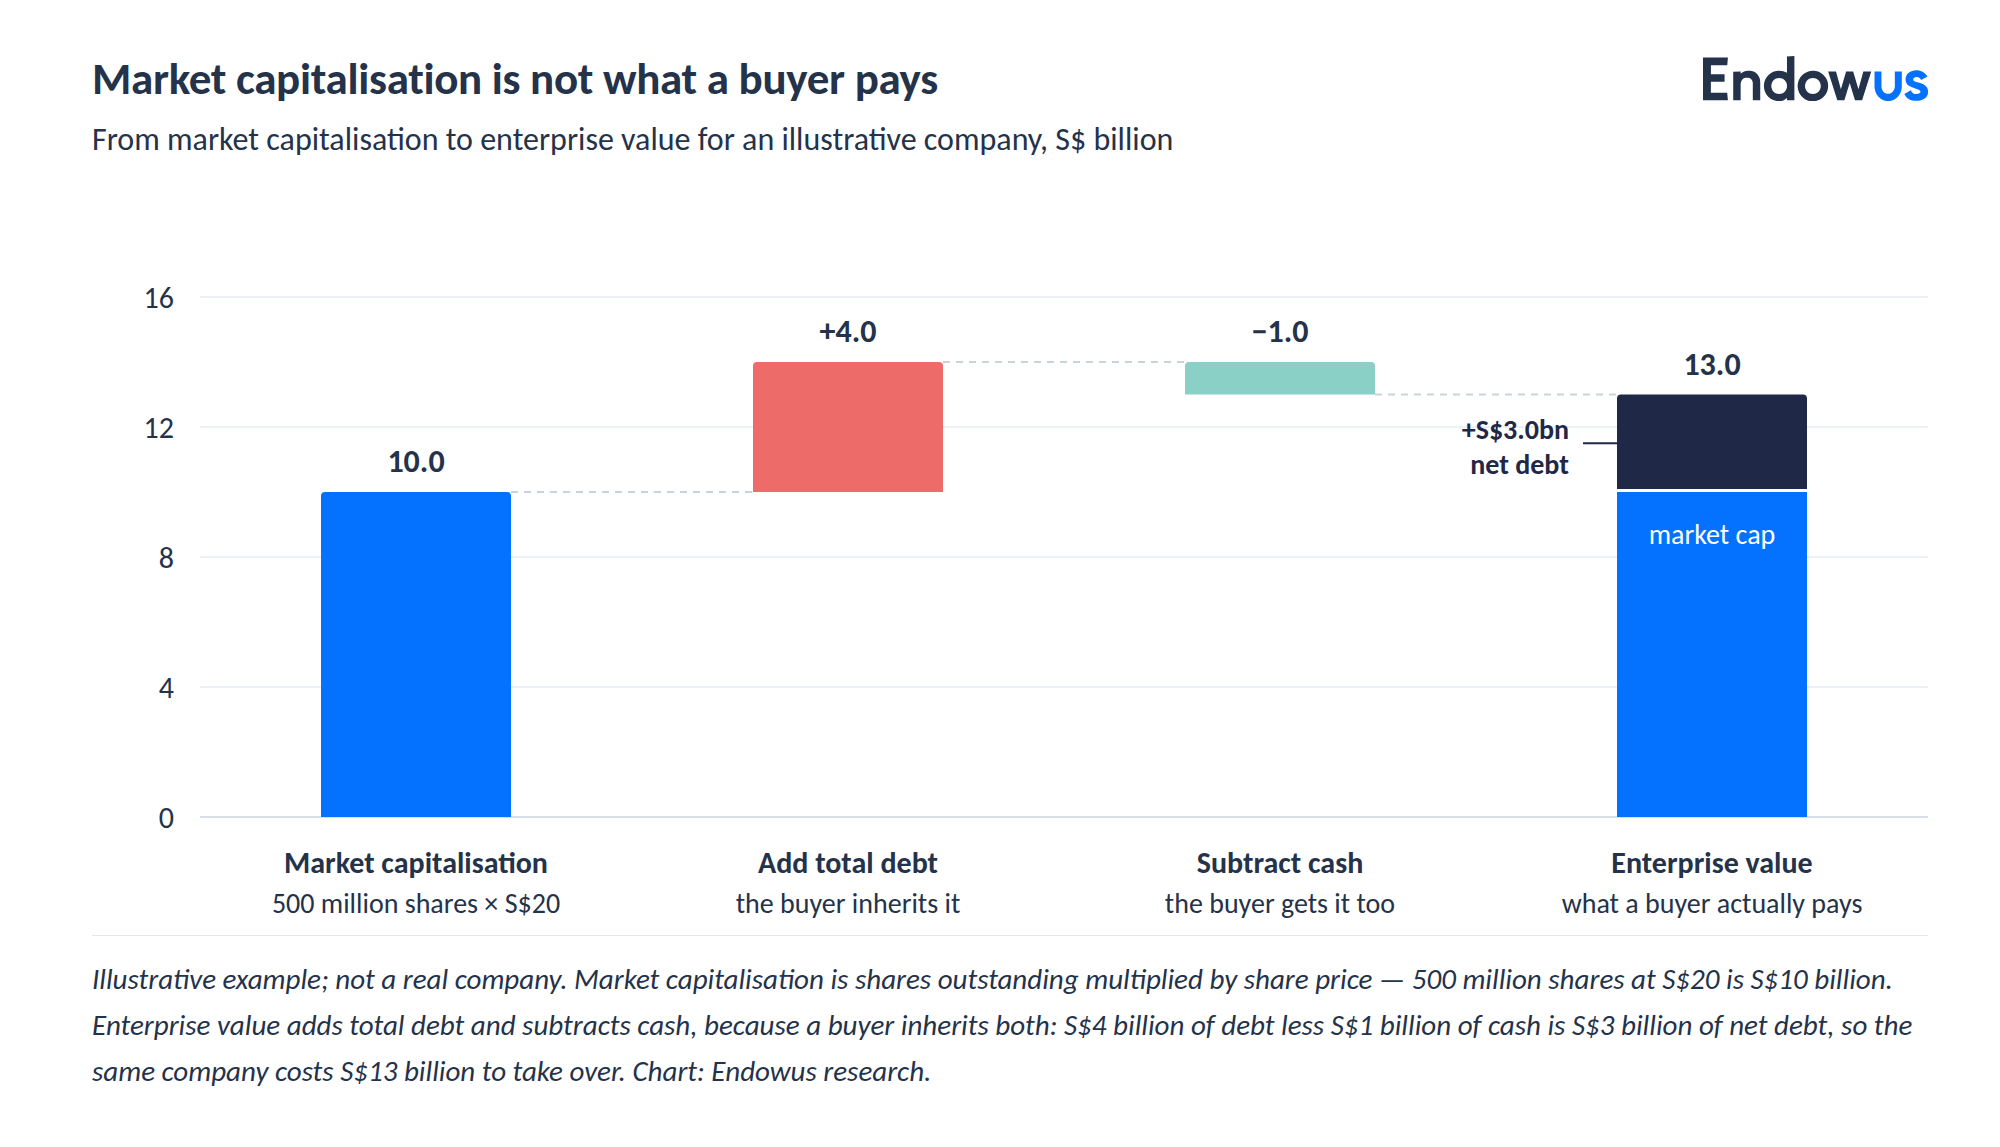
So market cap is a price for the equity alone. The more consequential point for investors is, however, how that relates to allocation strategies.
Small, mid and large: where the lines are drawn, and who draws them
There is no single, authoritative definition of a small-, mid- or large-cap company. There are several, and they may have different criteria.
S&P Dow Jones Indices sets fixed dollar thresholds and revises them periodically: as of 1 July 2025, S&P 500 eligibility begins at an unadjusted market cap of US$22.7 billion, the MidCap 400 runs from US$8.0 billion to US$22.7 billion, and the SmallCap 600 from US$1.2 billion to US$8.0 billion. FTSE Russell ranks eligible companies by size once a year and lets the boundary float wherever the market puts it, so the Russell 2000 is defined by rank rather than any dollar figure. MSCI uses a third method again — coverage bands, in which large caps are the top 70% of each market’s free-float value, mid caps the next 15%, and small caps the slice from 85% to 99% — a relative line that falls at a different absolute size in every market.
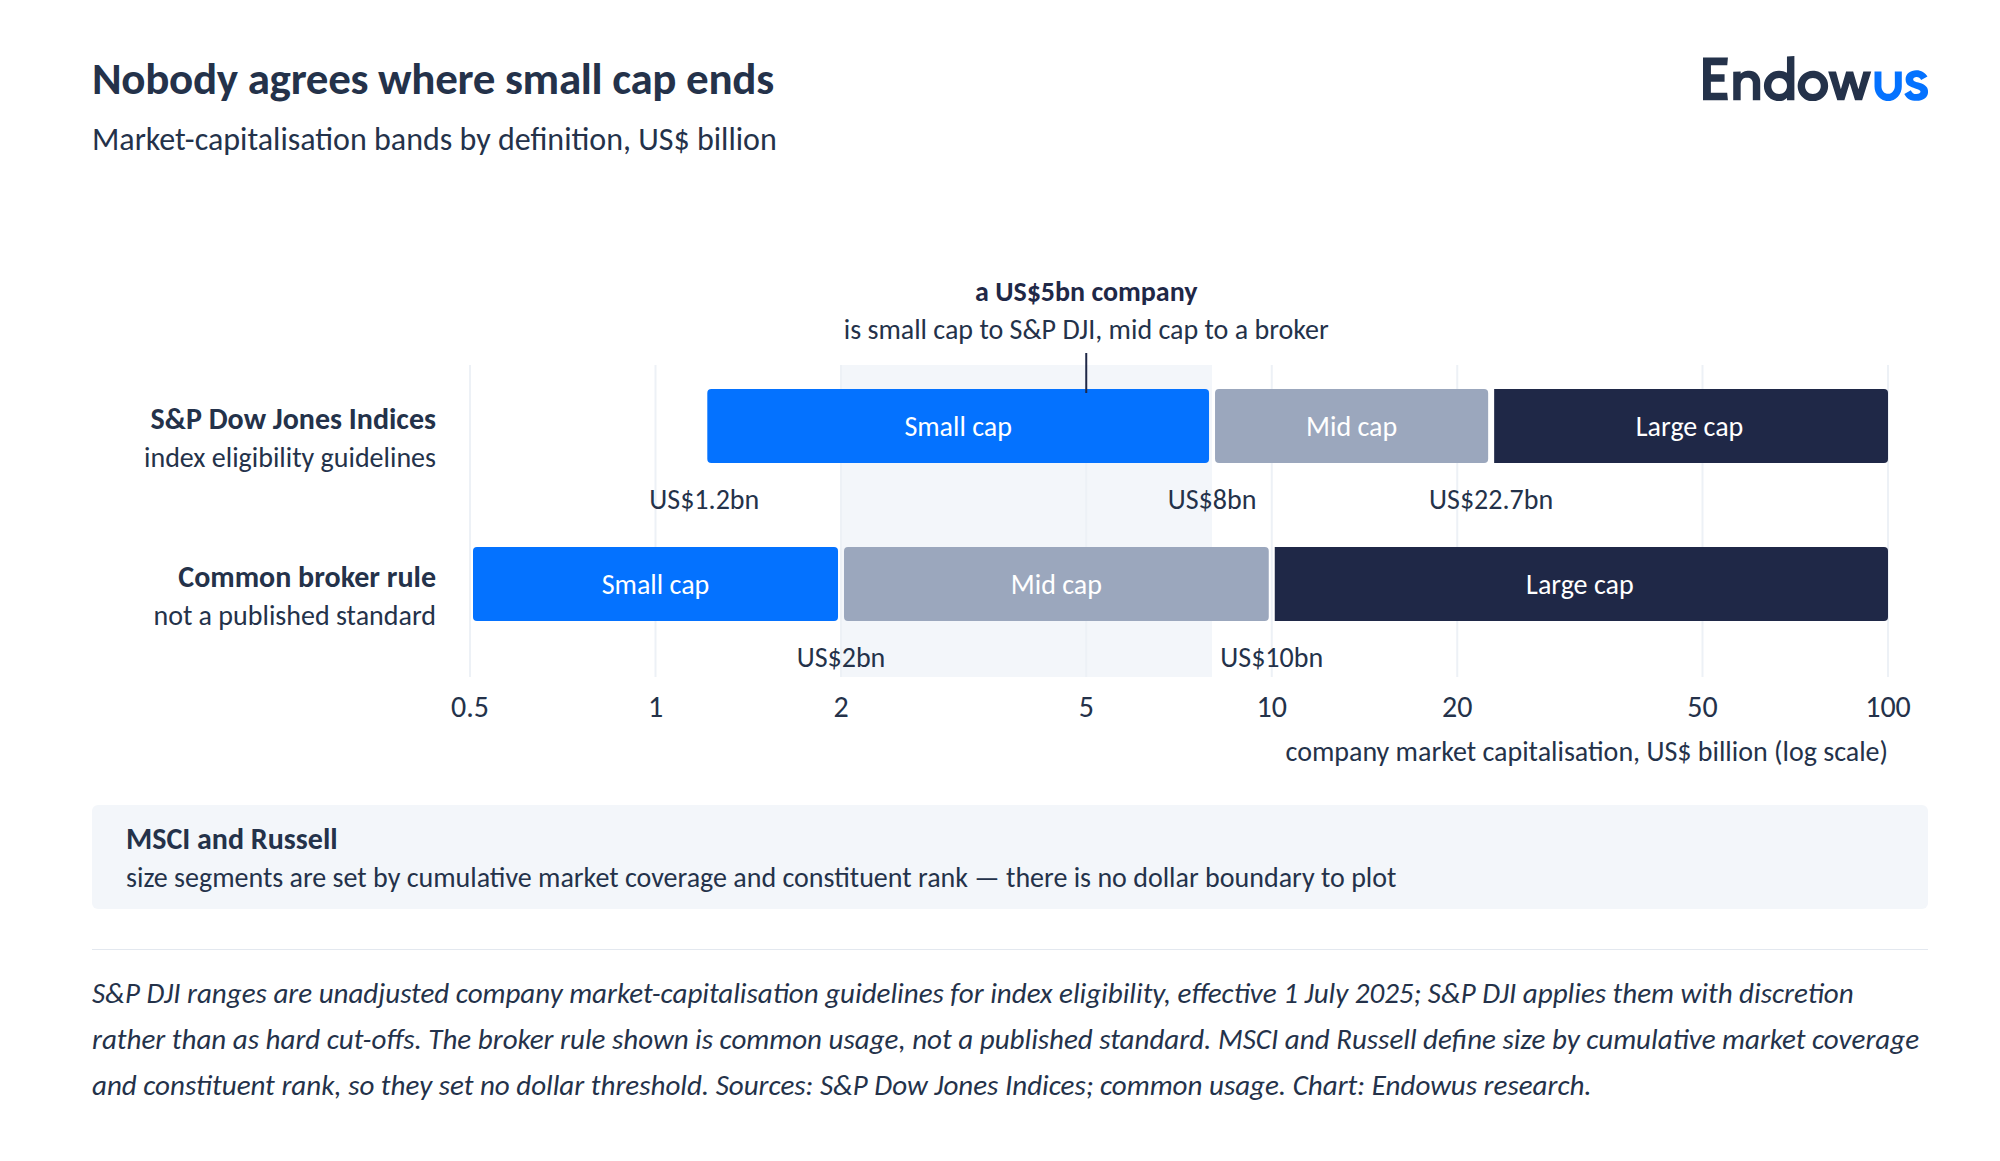
An additional point to make is related to the difference in market cap labels depending on a specific geography. A US$2 billion company is small-cap under the common broker rule and sits inside the S&P SmallCap 600 range — yet on the Singapore Exchange it would rank among the larger listed names outside the index heavyweights.
Finally, and intuitively, the bands also move with the market, so a “large-cap” cut-off from five years ago is already out of date, because the thresholds climb as prices do.
Market cap is a weighting instruction, not a size label
Something important to note is that there are indices that specifically include only small caps, while others have a mix of small, medium and large caps.
The latter hold each company in proportion to its market capitalisation. The larger the company, the larger its position, and as a company grows, the index will include more of it, automatically.
An index is not investable and should not be confused with an index fund - which replicates the index’s exposure to give investors an opportunity to “own” the index. But as the index fund tracks the index, the change in the index composition will automatically apply to the index fund.
Market-cap weighting is cheap to run, rebalances itself as prices move without any trading, and expresses no opinion on which companies deserve a larger place, it simply mirrors the market’s aggregate judgment.
It is also only one way to build an index: price-weighted and equal-weighted schemes each behave differently, as our guide to the different types of equity index explains. The advantages are real and the alternatives carry costs of their own. What the next section makes concrete is the consequence the default carries — one the investor holds whether or not they examined it. (For how index funds are assembled in the first place, see our explainer on index funds.)
What market-cap weighting produces today, in the US and in Singapore
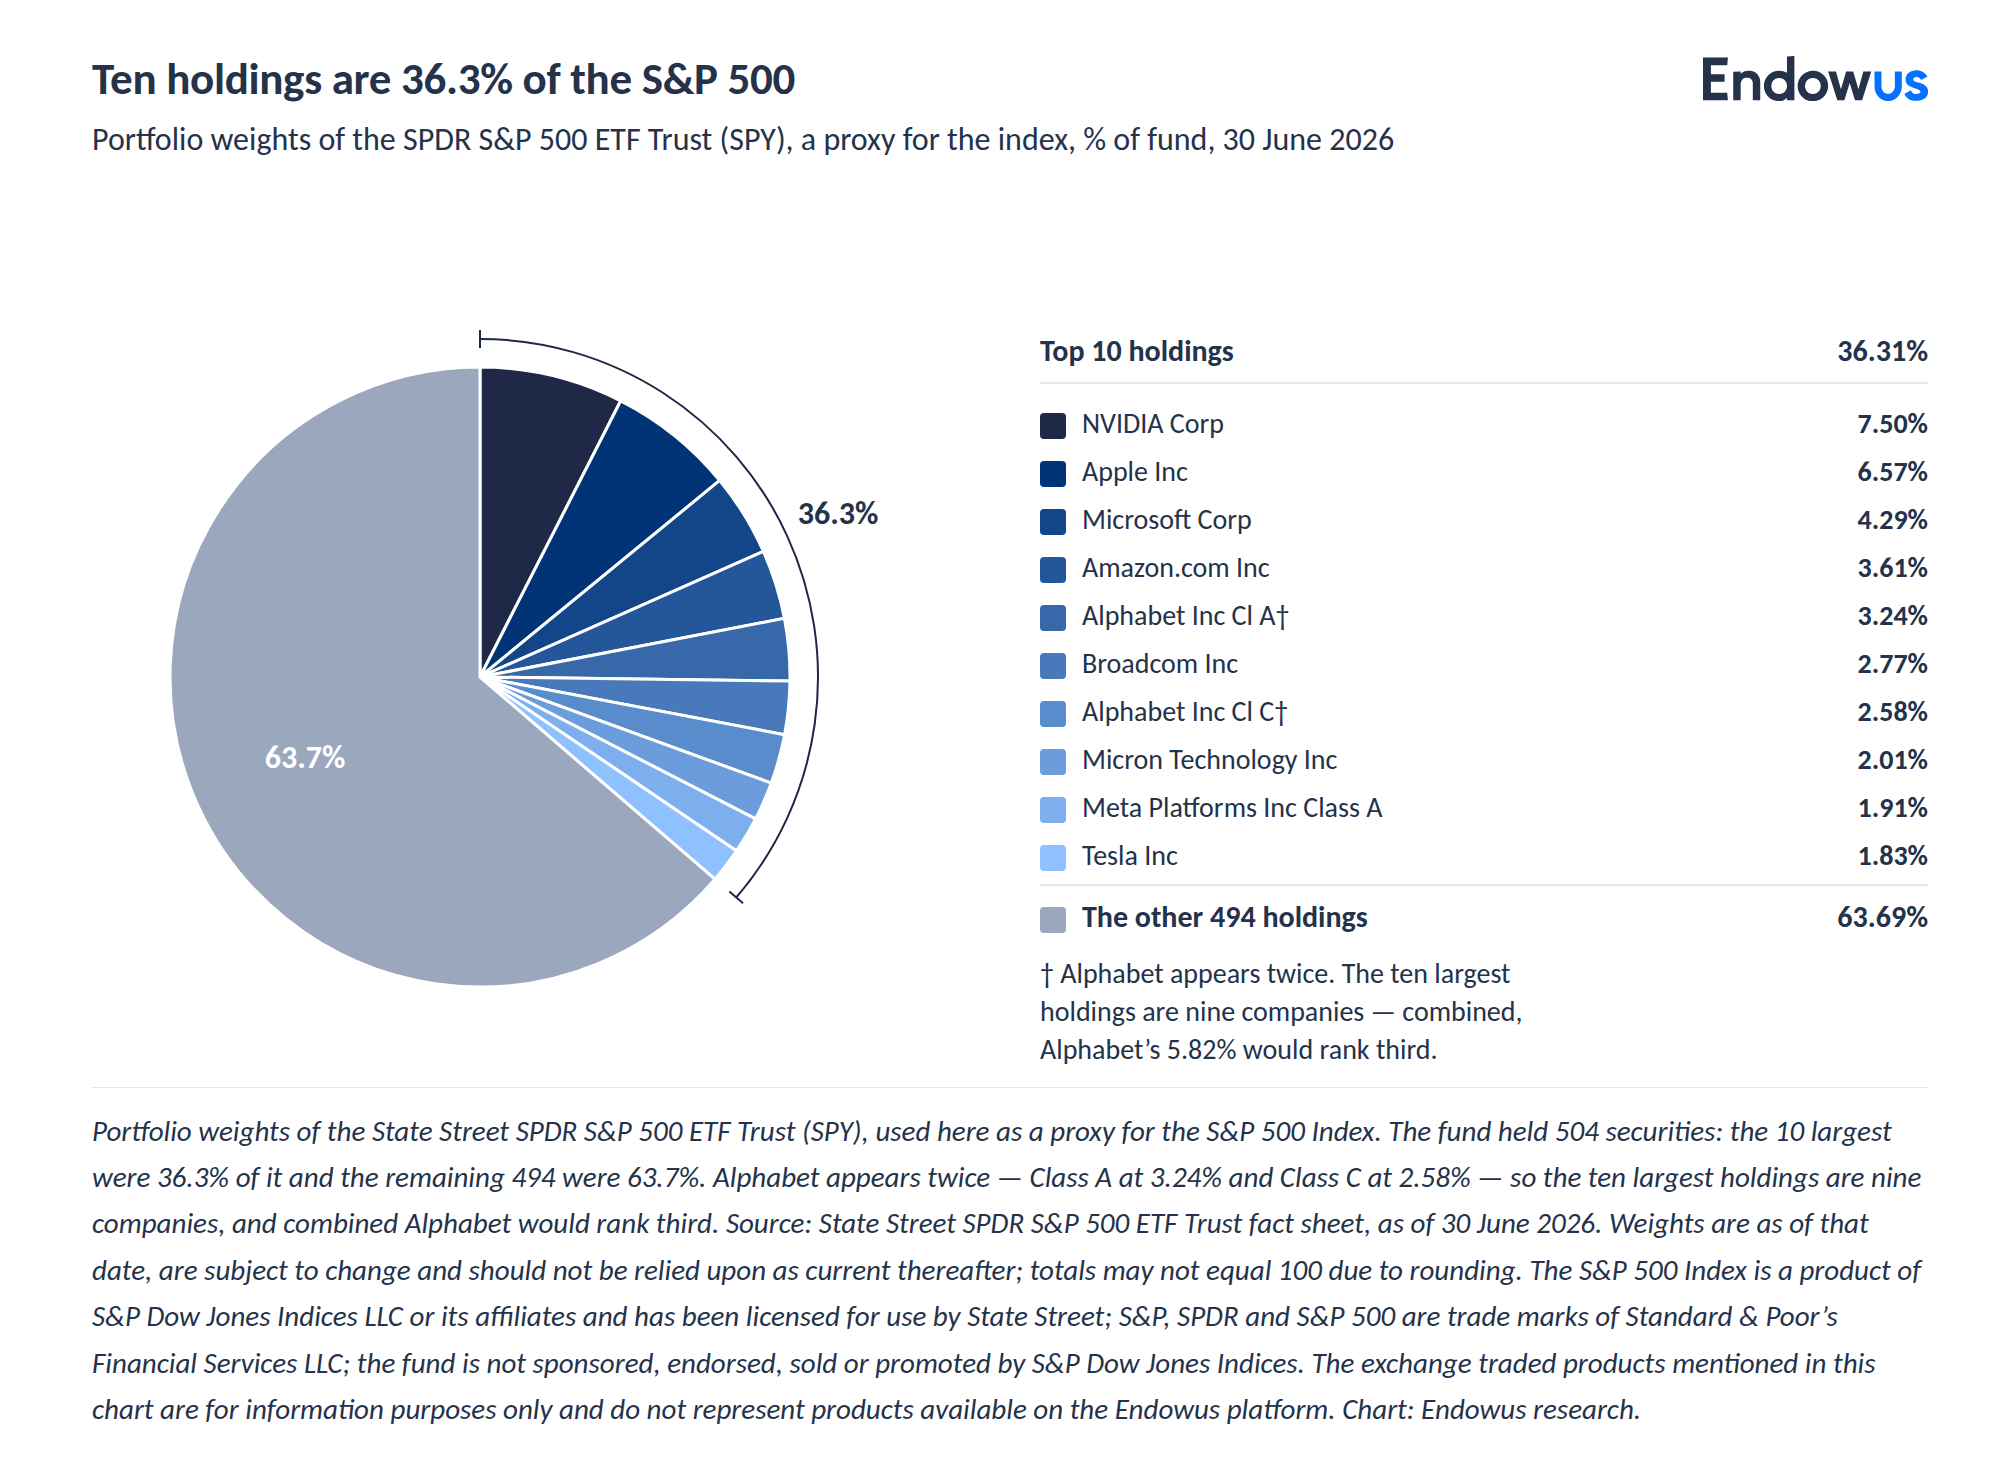
In the United States, the ten largest companies in the S&P 500 (proxied by the SPDR S&P 500 ETF Trust, or SPY) were 36.3% of the index as at 30 June 2026, and the single largest, Nvidia, was 7.5% of it. A little over a decade ago the top ten were closer to a quarter. An investor in a US total-market or S&P 500 fund therefore may hold more than a third of that position in ten companies, and 7.5% of it in one.
In Singapore the concentration is sharper still and closer to home. DBS, OCBC and UOB together were 57.8% of the Straits Times Index by 31 August 2026 (based on the FTSE Russell Factsheet for the index fund tracking the STI, which may be an approximation), up from 39.6% in 2019, as shown in the chart below.
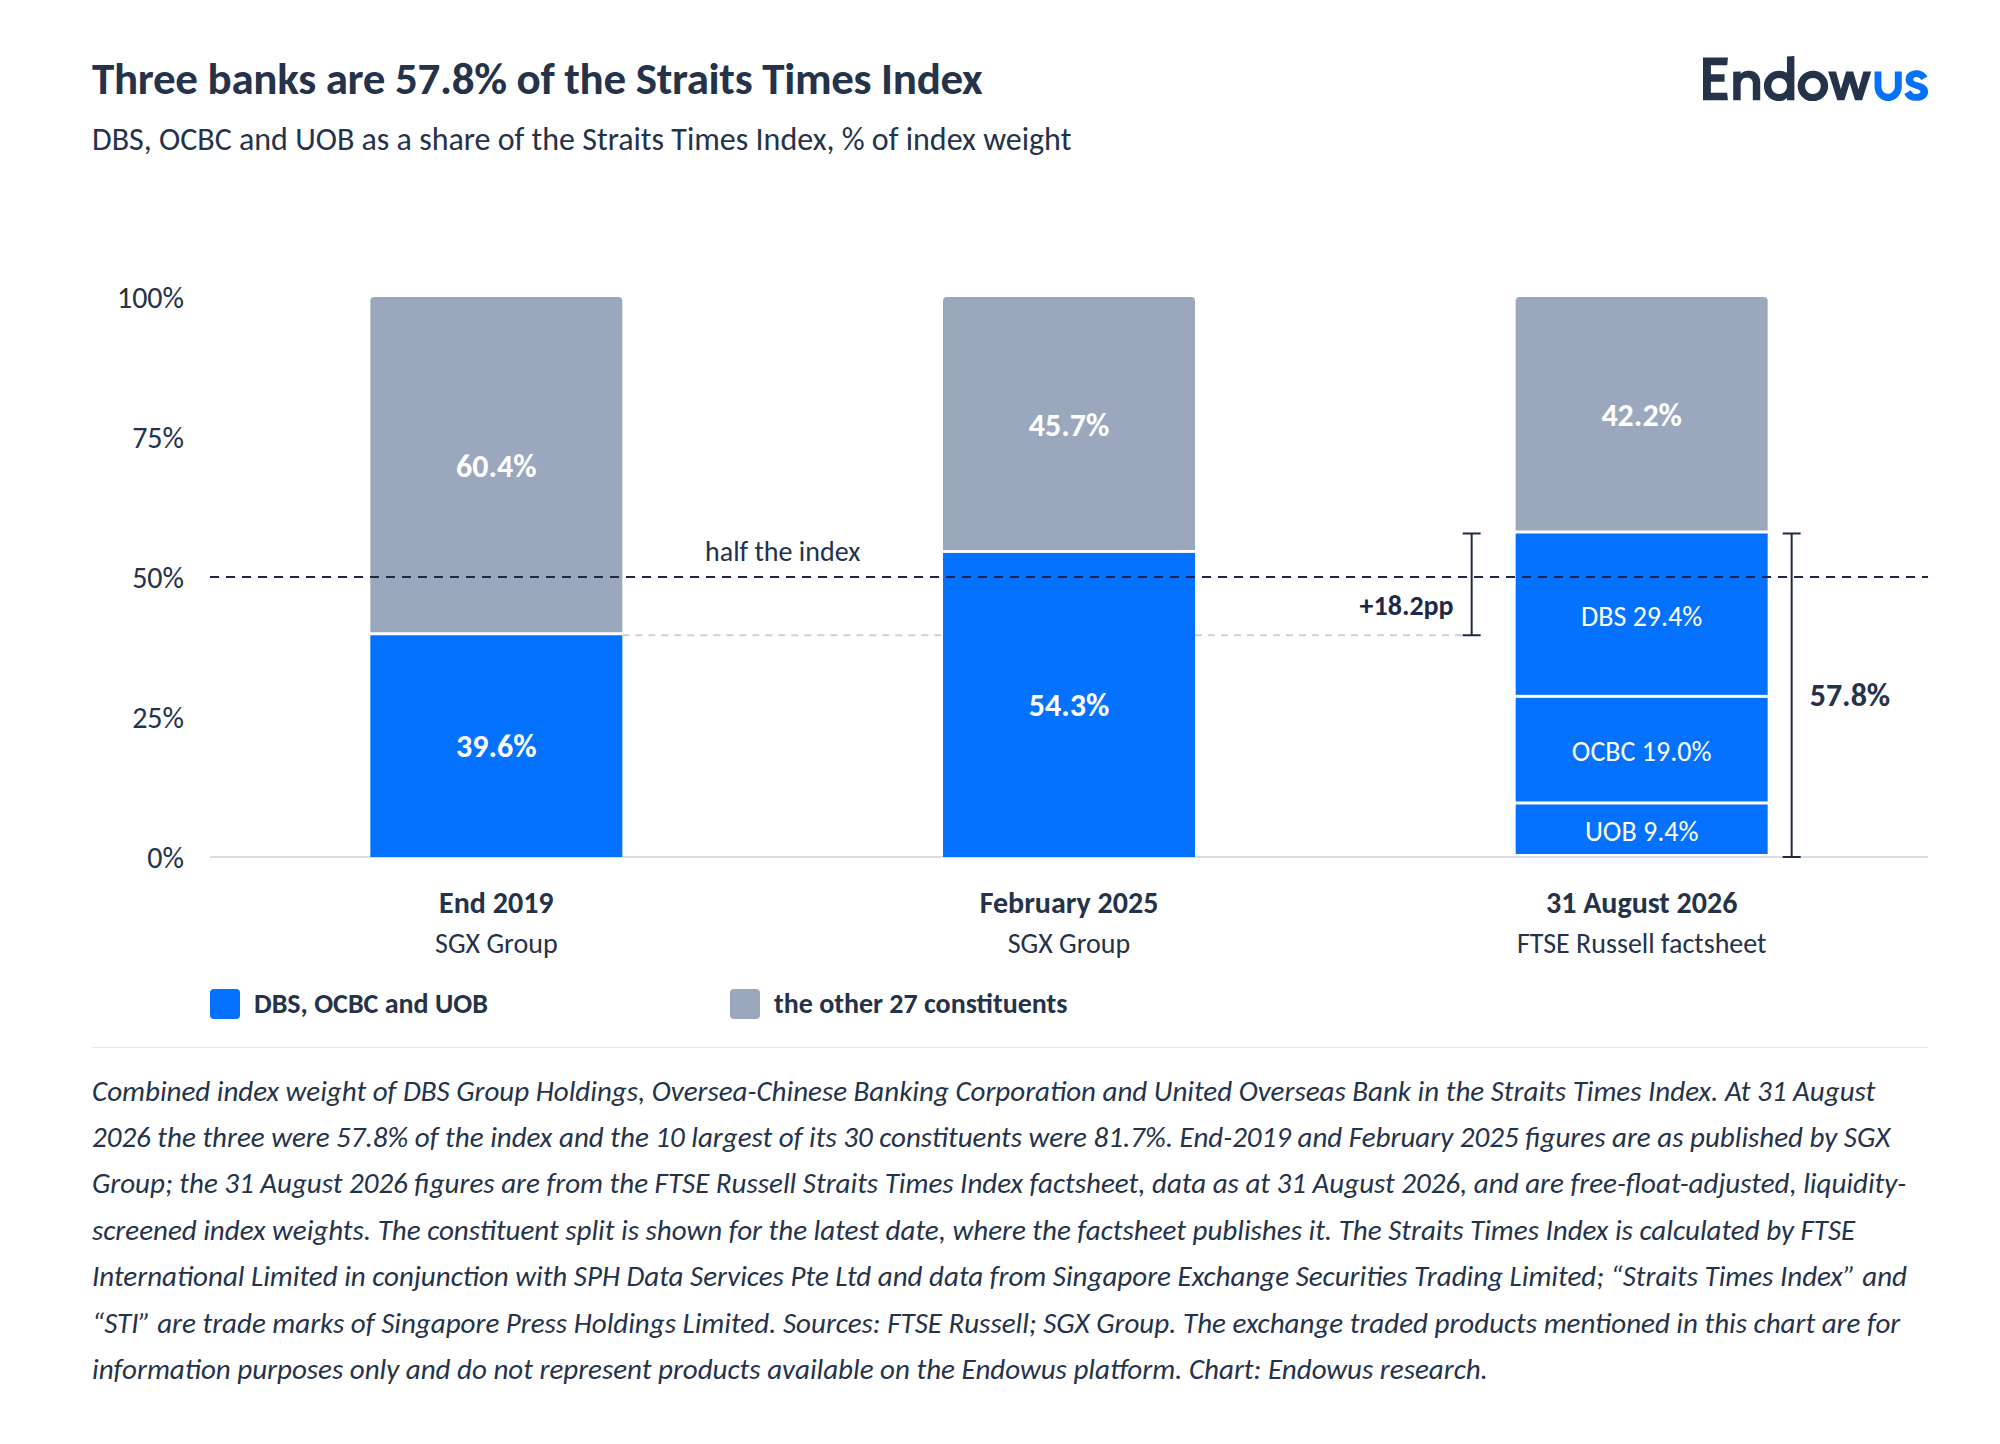
An STI tracker is likely to be heavily concentrated in local Singapore banks. Disclaimer: that is a statement about index holdings, not a judgment as to whether owning exposure to Singapore banks is a good or bad investment decision.
For both the US and Singapore markets, figures move with prices and with each index review, so they are snapshots rather than constants. But overall, the point stands that an index fund tracking in a concentrated index ends up reproducing the same concentrated exposure. That may limit the investment’s diversification potential.
Why should you own small-cap companies in your portfolio?
If the largest companies dominate a market-cap-weighted index, the natural question is whether the smaller ones are worth holding in addition to that. The academic answer has a long history and a more complex recent record.
The case rests on the size premium - the finding, first documented by Rolf Banz in 1981, that smaller companies have historically earned higher returns than larger ones over long periods. It is one of the foundations of factor investing, and it has an intuitive logic: smaller companies are riskier - they may be more volatile - so investors have demanded more to hold them. (Size and value are close cousins as investment arguments but should not be confused; our piece on value investing covers the neighbouring idea.)
But premium has been underperforming recently. Over the two decades to the end of 2024, US small caps lagged US large caps — a fact conceded by Dimensional, a manager that builds portfolios around the premium and remains one of its advocates. Dimensional’s own framing deserves the nuance: over that same period, small caps in developed markets outside the US and in emerging markets outpaced their large-cap counterparts, which it reads as statistical noise rather than a broken idea.
Research about the small caps premium is aplenty. Aswath Damodaran of NYU Stern has questioned whether a reliable small-cap premium survives once trading costs and liquidity are accounted for, and research from AQR has argued that much of the premium appears only after controlling for company quality. Past performance is not necessarily a guide to future performance or returns.
What can go wrong further down the scale
Deliberate small-cap exposure carries specific risks. Smaller companies trade less, so the gap between buying and selling prices (bid-ask spread) is typically wider and exiting in a hurry may cost more. These are companies with comparatively fewer products, customers and markets to fall back on, and the failure rate may be higher.
They are also less watched. Fewer analysts follow them, which is part of the argument for opportunity (more room for dislocations) but also means thinner information and less scrutiny. And there is a trap in the long-run record itself: the small-cap indices you can measure today contain the companies that survived, while the ones that failed have dropped out - something we call “survivorship bias.”
For a Singapore investor there is a further distinction that is easy to miss. “Small-cap” in a global fund and “small-cap” on the SGX are different exposures, with different liquidity and different risks.
How to check what you actually own
The first thing to check is the combined weight of the top ten holdings of an index fund, which almost every factsheet prints and which reveals how concentrated a “diversified” fund really is. The second is the split by company size, sometimes shown as a market-cap breakdown, which shows whether the fund holds mid- and small-caps at all or only the giants (or only the small and mid-caps). The third is what the fund actually tracks: a “global equity” label typically means large- and mid-cap developed markets, frequently with little small-cap and limited emerging-market exposure, so there may be less diversification than the headline “global” suggests. The fourth is the weighting method of the index fund - market-cap or otherwise.
Investment implications
The purpose of understanding market cap is to hold it knowingly, and to decide whether the concentration it produces matches what you want.
For most investors, a broad, low-cost, market-cap-weighted index fund remains a sensible core. But it is important to understand if this index fund is tracking a concentrated index, because the decision to accept that tilt needs to be deliberate.
In addition to that core exposure, investors can allocate part of their portfolios across more markets to dilute large-cap exposure, or add a deliberate size or factor exposure.
At Endowus, an investor looking for a potentially diversified allocation across markets and company sizes decided and rebalanced for them can use the Flagship Portfolios, while an investor who wants to add a deliberate size or factor tilt — or a specific income angle, such as dividend strategies — can build it through Fund Smart. Both are exposed to market risk and neither offers a capital guarantee.
On the one hand, market-cap weighting may potentially be inexpensive, self-correcting and hard to beat consistently, and there is a strong case for simply owning it. On the other, owning it without knowing its shape is how investors end up more concentrated than they intended.
Frequently asked questions
Is a high market cap good?
Not by itself. A high market capitalisation tells you a company is large and that the market values its equity highly; it does not tell you whether the shares are cheap or a good investment from here. A larger company usually carries a different set of risks from a smaller one. And in a market-cap-weighted index fund, a higher market cap simply means the company is a bigger position in your portfolio.
What does market cap mean?
Market capitalisation is a company’s share price multiplied by its total shares outstanding. It is the market’s current price for all of the company’s equity. A company with 500 million shares at S$20 has a market cap of S$10 billion.
What is Singapore’s market capitalisation?
The total market value of Singapore-listed domestic companies was about US$824 billion at the end of 2025, according to World Bank data. The figure moves with the market, so check the latest total from SGX for a current reading.
What is the difference between market cap and enterprise value?
Market cap is the price of a company’s equity alone. Enterprise value adds the company’s debt and subtracts its cash, because anyone buying the whole business inherits both. Enterprise value is usually the better measure of what it would cost to acquire a company outright.
Is an index fund diversified?
Both more and less than it looks. A broad index fund spreads your money across hundreds or thousands of companies, which is real diversification. But because it is market-cap weighted, a large share sits in the biggest few — the ten largest were 36.3% of the S&P 500 as at 30 June 2026. Diversified across many and concentrated in a few: both are true at once.
Forget your password? It's a good thing for your investments

The lesson of Hyflux: What water and diversification have in common

Free lunch: Diversification in investing is a gift
.jpeg)


%20F1(2).webp)

.webp)
.webp)






.webp)