


.webp)
.webp)
.webp)
.webp)






.webp)












%20(1).gif)
Register for the event
Endowus invites you to our exclusive event with Macquarie Asset Management, as we discuss unlocking opportunities in Infrastructure- a $1.3tn asset class.
This event is reserved for Accredited Investors (AIs) only. To register for the event, please indicate one of the following:
- Since 1980 the trade-weighted dollar has moved in three broad rising phases and two falling phases of roughly 35% to 55% each, followed by a smaller pullback since 2025 according to Federal Reserve data, a fairly large source of return variation.
- The euro is 57.6% of the widely quoted dollar index (DXY), so most of DXY’s movements are actually dollar-euro FX moves. An additional finding is that a stronger dollar tightens financial conditions across emerging markets.
- Interest rates have an impact on dollar strength, but the channel is not always straightforward. The dollar has risen after US rates peaked, fallen through multi-year hiking cycles, and, in 2025, weakened while the Federal Reserve was on hold.
The US dollar underpins much of the global financial system. It denominates roughly half of all cross-border bank loans and international debt securities, prices most commodities, and sits on either side of the majority of the world's currency transactions. When the dollar strengthens or weakens across a multi-year cycle, the consequences reach well beyond the United States into the euro, into the borrowing costs of emerging economies, and into the returns of a globally diversified portfolio in Singapore-dollar or Hong Kong-dollar terms.
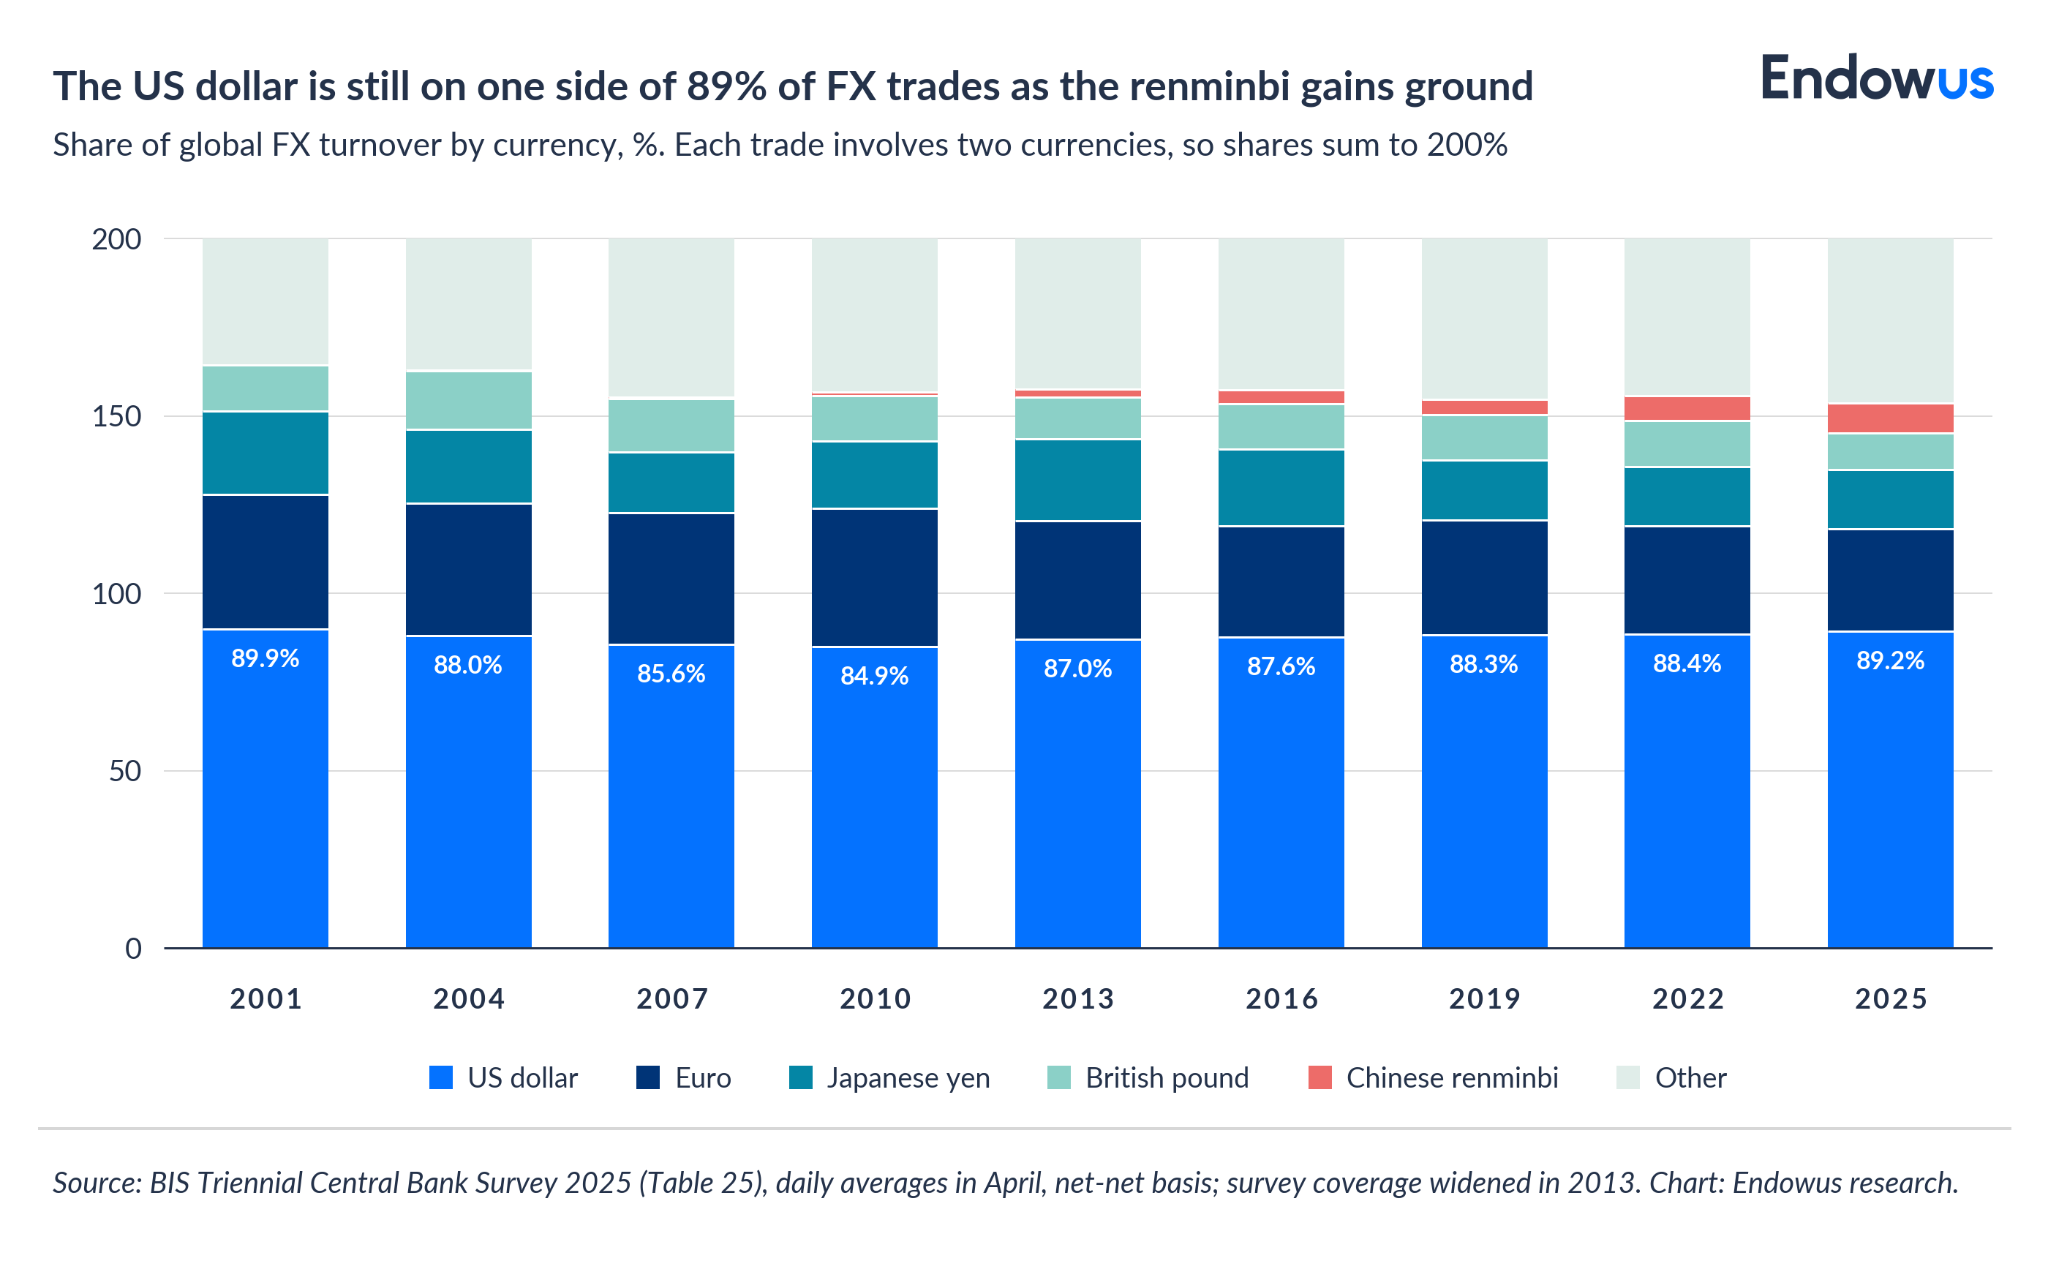
This article’s goal is to identify and explain long-term dollar move cycles, which can have an impact on the performance of other currencies - the euro first and foremost, and beyond that, other developed and emerging market currencies.
The main point here is that US interest rates explain only part of the picture. A wider US rate advantage has, against the foundational theory of uncovered interest rate parity (UIP), often supported the dollar, but the link is loose and changes over time. The dollar has climbed while rates fell, weakened while the Federal Reserve raised them, and responded to growth, risk appetite, and policy credibility at least as much as to the yield gap between the US and other countries.
The practical conclusion is that forecasting the cycle is a tall order, and some of the best analysts and chief economists often miss the mark.
The analysis draws on four decades of Federal Reserve data and on research from the Bank for International Settlements (BIS), the International Monetary Fund (IMF), as well as academic literature. It traces the major cycles since 1980, explains why the euro and emerging-market currencies tend to be correlated and mirror the dollar, examines what interest rates do and do not account for, and closes with the implications for portfolio construction and currency hedging.
The dollar moves in long cycles
Evidence from historical data shows that the dollar broadly moves in long cycles of appreciation and depreciation.
We’ve looked at two different indices, two gauges of the dollar exchange rate with other currencies.
- The ICE US Dollar Index (DXY) is more narrow. It is a fixed-weight basket of six currencies whose composition has changed only once, in January 1999, when the euro replaced its predecessor currencies (but without deviating from their collective weight). The DXY is the most utilized proxy for US dollar strength.
- The second is the Federal Reserve's trade-weighted broad dollar index, which covers 26 economies (including China, Mexico, and other emerging markets) and is a more comprehensive signal.
Looking at the trade-weighted dollar, we can clearly recognize alternating rising and falling phases, each lasting around five to seven years, with the amplitude of a full swing typically between 35% and 55%. Past performance is not necessarily a guide to future performance or returns, but the regularity of the cycle across very different macro regimes is difficult to dismiss.
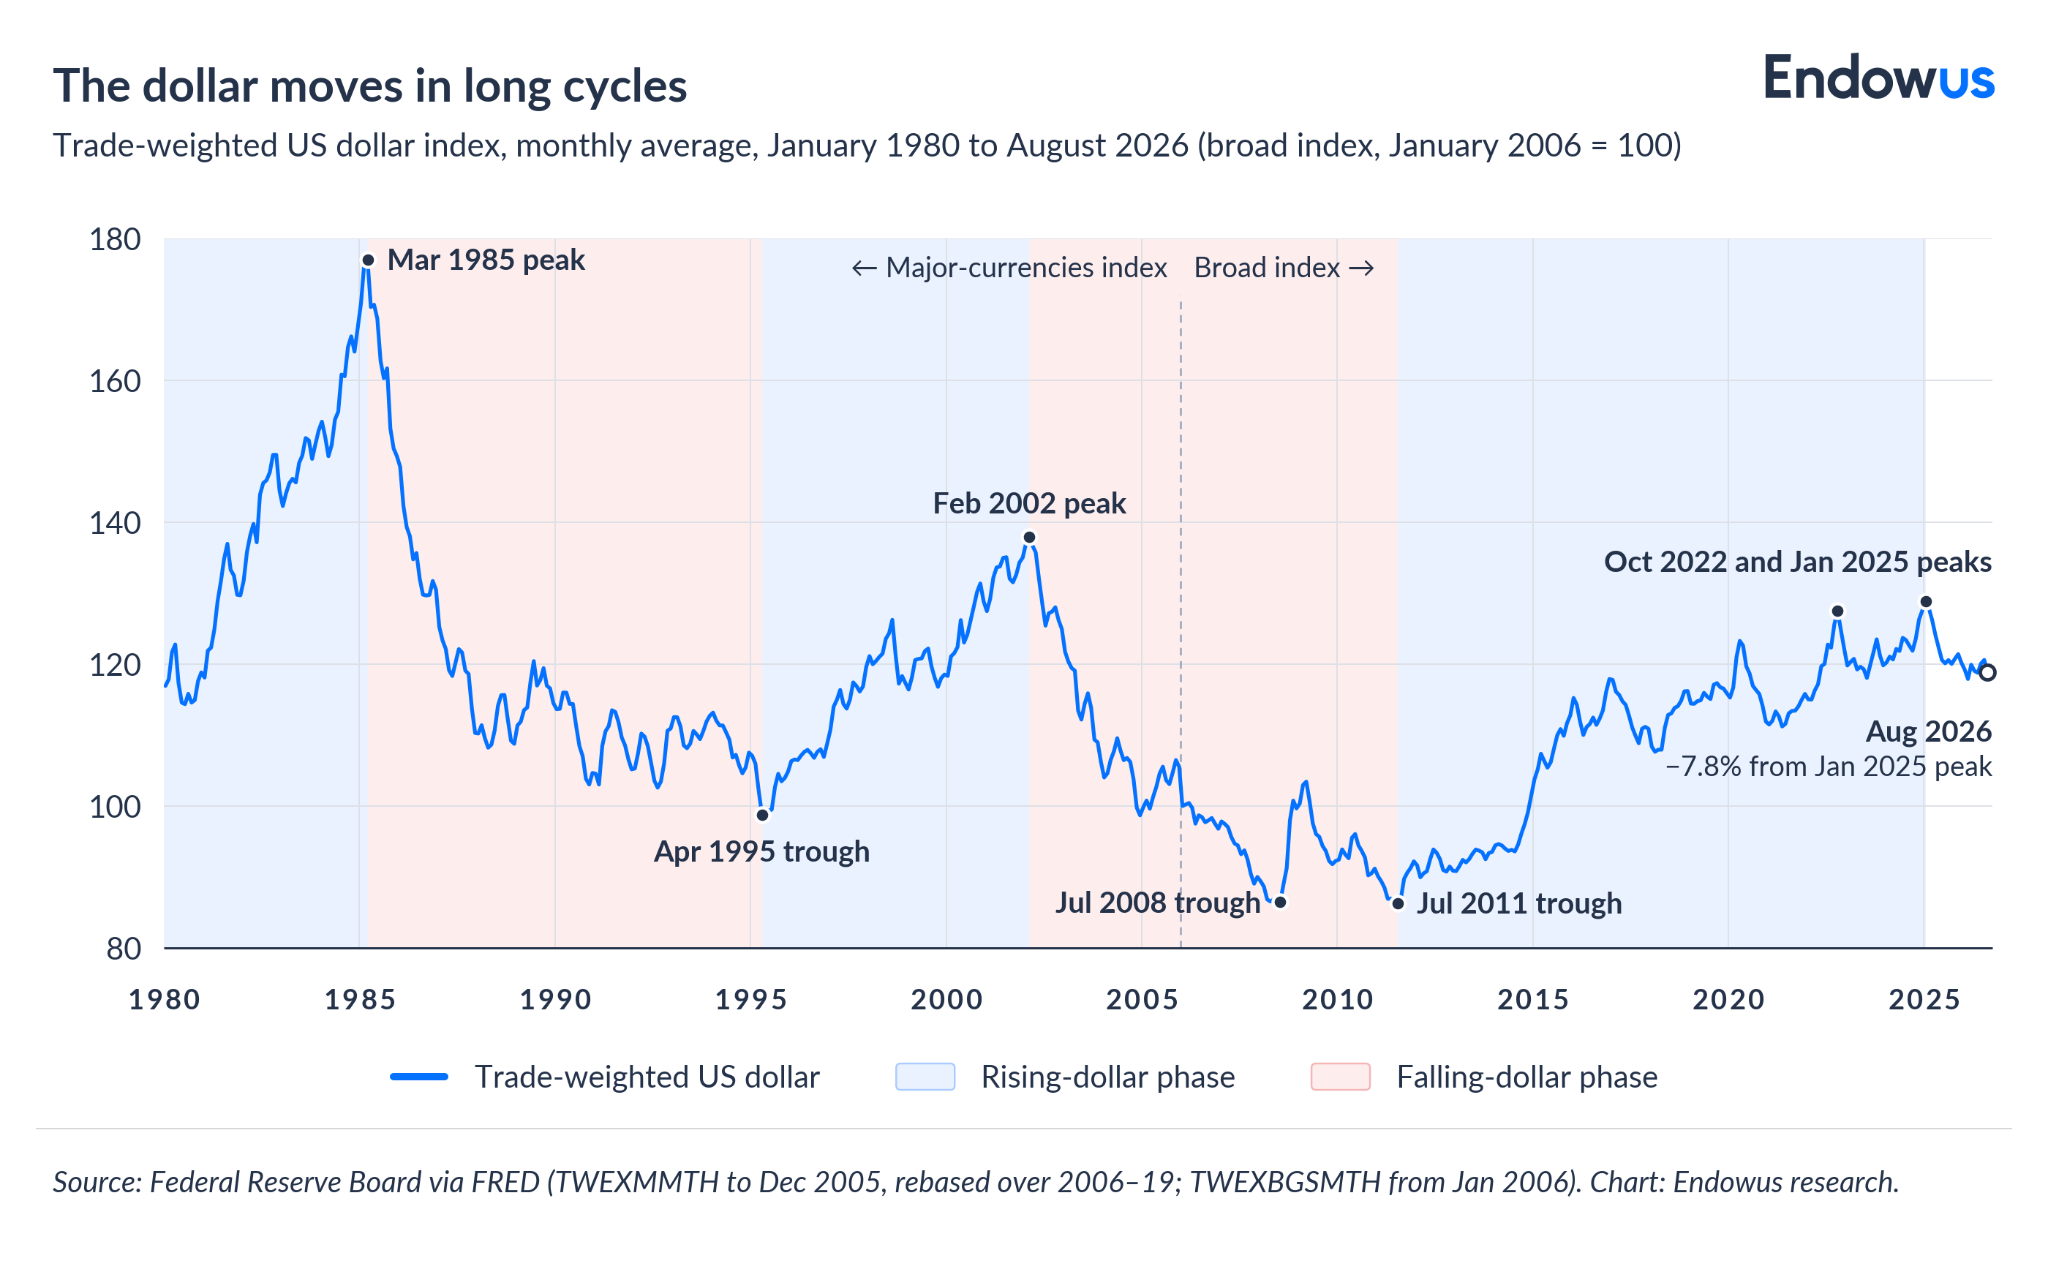
The surge of the early 1980s coincided with Chair Paul Volcker’s Federal Reserve pushing policy rates to record highs, a large US fiscal expansion, and heavy capital inflows (which increased the demand for dollars). The decline that followed the 1985 peak began after the Fed started easing, and post the coordinated intervention of the Plaza Accord in September 1985 (“...some further orderly appreciation of the main non-dollar currencies is desirable…” - Paragraph 18 of the Plaza Accord), later stabilised at the Louvre Accord in February 1987 (“...They agreed to cooperate closely to foster stability of exchange rates around current levels…”)
The dollar bottomed in April 1995 (within weeks of US Treasury Secretary Robert Rubin articulating what became the "strong dollar" policy) then rose through the late-1990s productivity boom and through the US turning fiscal deficit into surplus, peaking in early 2002. The long slide to 2008 tracked record US current-account deficits and a commodity-led emerging-market boom.
The most recent phase has been an unusually long cycle. On the broad index, the dollar appreciated for more than a decade from 2011, with some interruptions, reaching its highest monthly readings in late 2022 and again in early 2025 before falling back through 2025 and 2026. In real, inflation-adjusted terms the broad dollar also reached a series high in January 2025, so this was a genuine appreciation rather than a nominal artefact. The episode shows that cycles can run longer and further than any single driver would predict.
The effect on the euro and emerging market currencies
Much of what is described as "dollar strength" is, arithmetically, also euro weakness (and the reverse). The euro carries a 57.6% weight in the DXY, so a 1% move in the euro against the dollar shifts the index by roughly 0.58% in the opposite direction before any other currency moves. The most-quoted barometer of the dollar is therefore, to a first approximation, an inverted chart of the euro.
The Fed's broad index dilutes this by giving the euro a smaller weight and adding China, Mexico, and other economies, which is one more reason the two measures can tell slightly different stories.
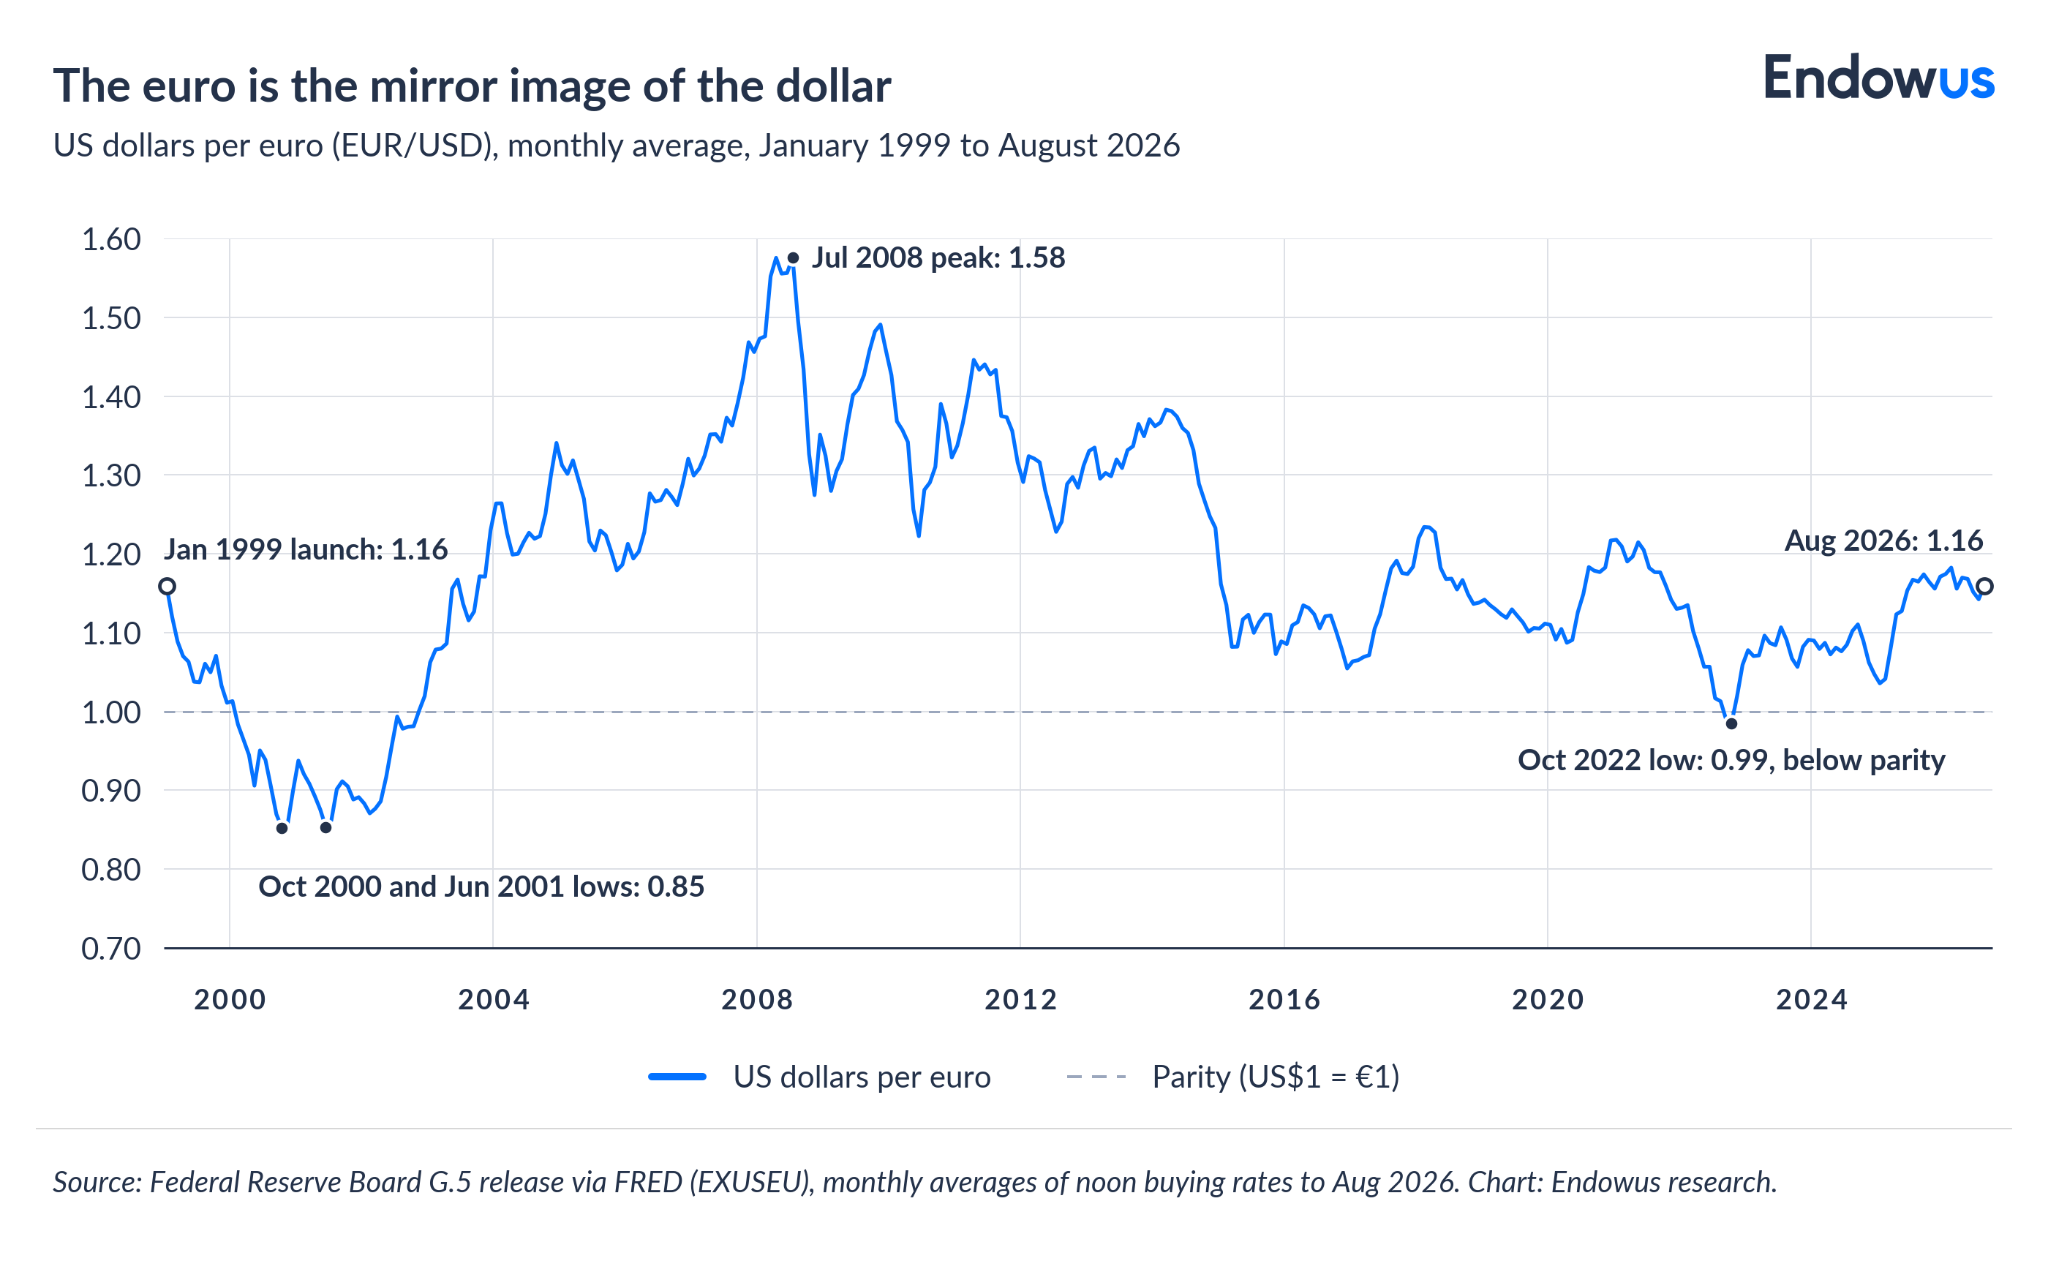
The euro launched near US$1.16 in January 1999, fell to about US$0.85 in 2000, and climbed to roughly US$1.58 in 2008 before the swings of the eurozone sovereign-debt crisis. It traded below parity in October 2022 and had recovered to around US$1.16 by August 2026. Reading this chart alongside the dollar cycle makes the mirror relationship easier to understand.
There is, however, a distinction between broad dollar moves and euro-specific moves. In the first quarter of 2025, the Federal Reserve Bank of New York attributed a decline in the dollar against the euro to narrowing interest-rate differentials, a weaker outlook for US growth relative to Europe, and uncertainty over US trade policy — a broad dollar story that happened to run through the euro. Other episodes were euro-specific: the currency's 2010–2012 weakness reflected the euro-area sovereign-debt crisis, and its softness in early 2026 reflected the region's exposure to an energy-price shock rather than any change in the dollar itself.
For an investor, the difference determines whether a move is likely to extend across other currencies or remain limited to the euro-dollar pair.
A stronger dollar tightens the world's financial conditions
Whether dollar strength or weakness percolates into emerging market currencies is extremely important, as it is a strong determinant of financial conditions.
Textbook trade theory suggests a stronger dollar should help emerging-market exporters by making their goods cheaper; in practice, the financial channel tends to dominate.
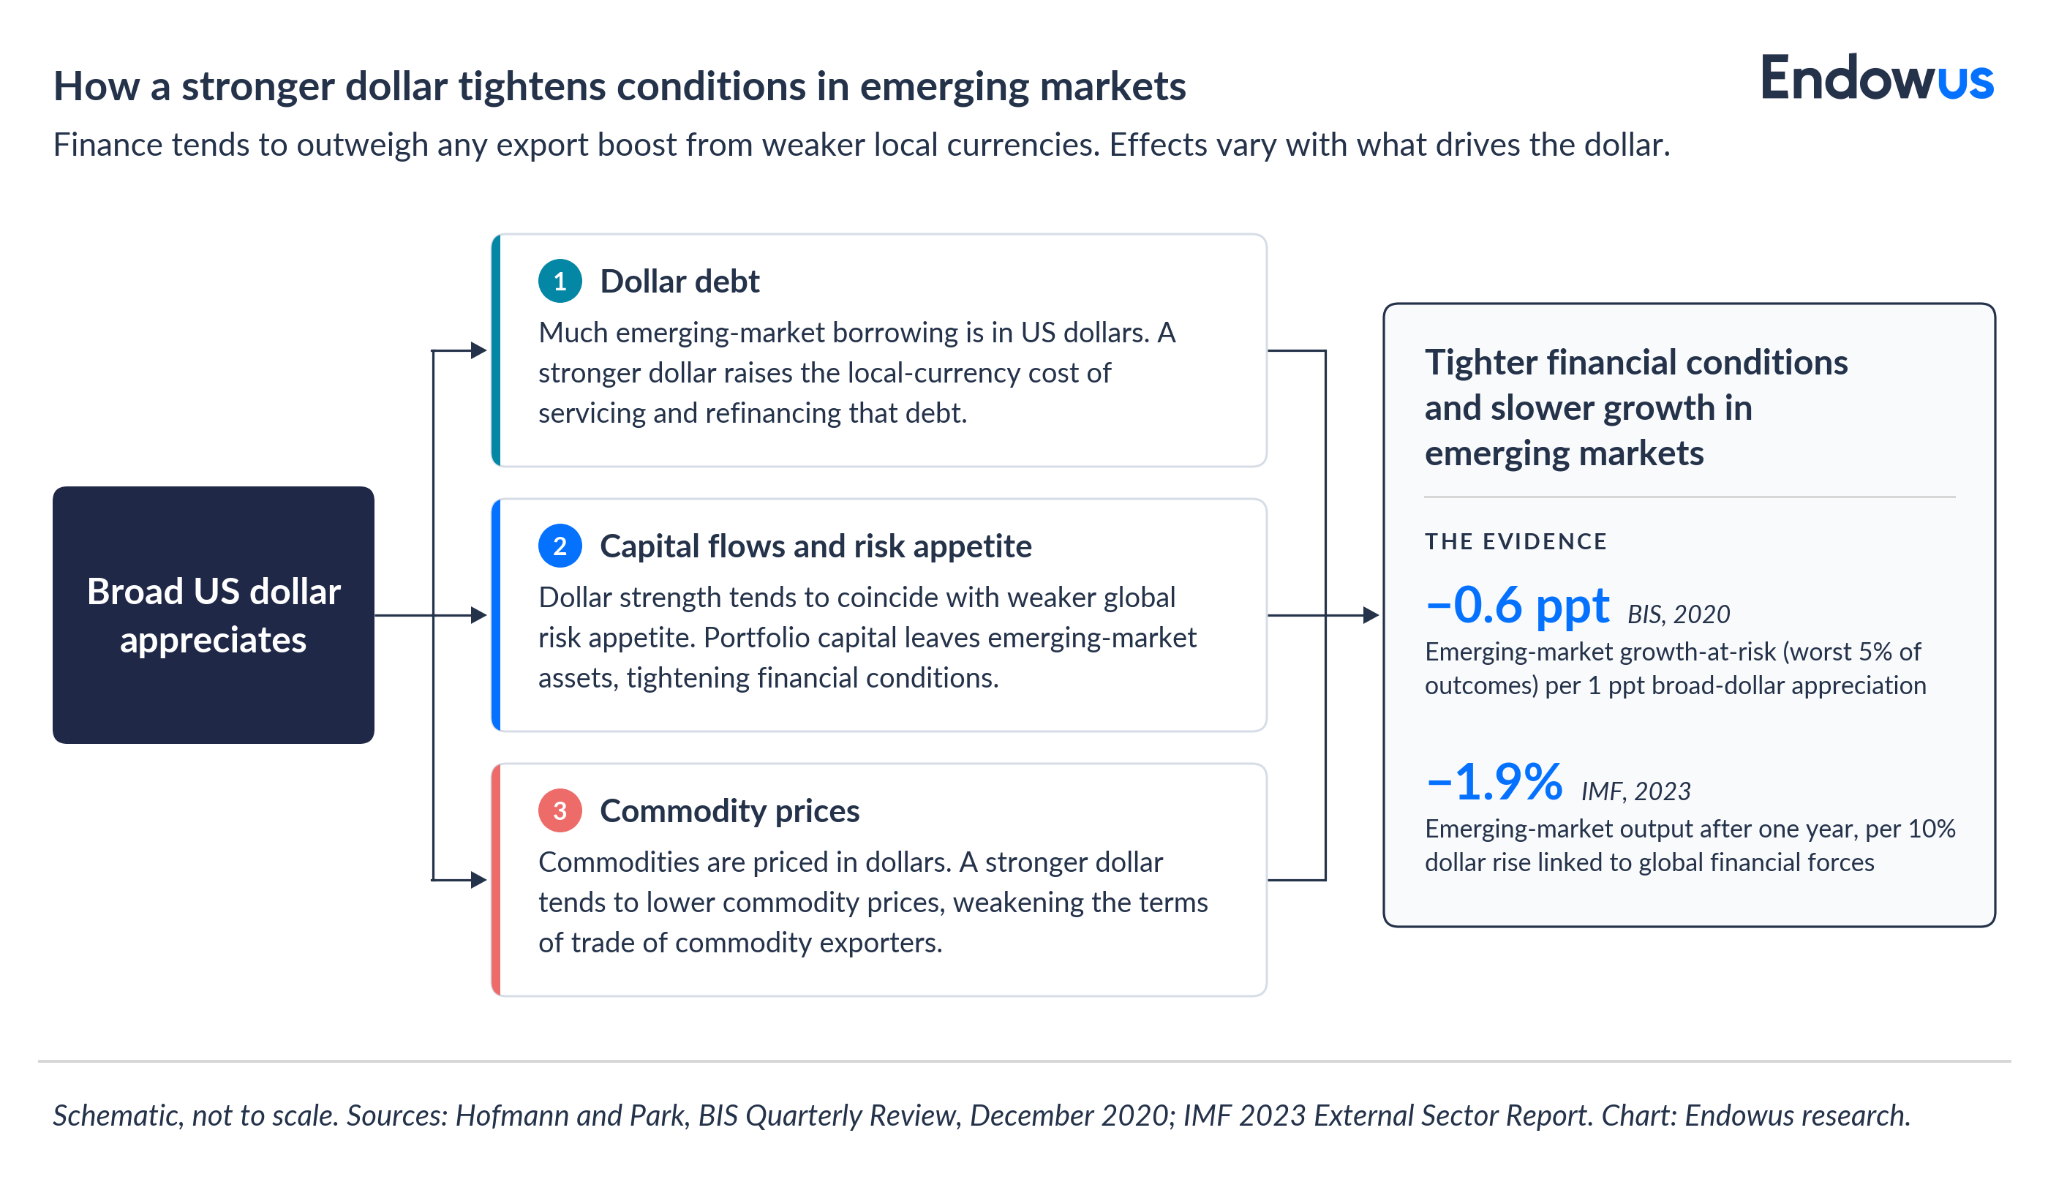
When the dollar strengthens, three things typically happen in emerging markets that more than offset the benefits of - potentially - cheaper exports.
- First, dollar-denominated debt becomes more expensive to service: much emerging-market borrowing is denominated in dollars, so a stronger dollar raises the local-currency cost of servicing and refinancing that debt. Bruno and Shin, in BIS research, find that a stronger dollar is associated with tighter dollar credit conditions and, following appreciation, some declines in bank credit and exports for firms that rely on dollar funding.
- Second, capital flows into the United States and away from emerging markets: dollar strength tends to coincide (though this is not always the case) with weaker global risk appetite - “risk-off” market sentiment, basically - which leads portfolio capital to leave emerging-market assets and seek safe haven in developed markets, especially the US.
- Third, commodities depreciate as the dollar appreciates: priced in dollars, they tend to weaken as the dollar rises, eroding the terms of trade of commodity-exporting economies - which many emerging markets are.
Academic research has time and again supported these findings. Hofmann and Park estimate that a one percentage point appreciation shock to the broad dollar lowers emerging-market growth-at-risk — the weak tail of the growth distribution — by about 0.6 percentage points, with a larger effect where dollar debt or foreign ownership of local-currency bonds is high. Obstfeld and Zhou, in work on the "global dollar cycle," find that dollar appreciation shocks predict downturns across emerging and developing economies and correlate with measures of dollar-funding stress that reflect global investors' risk appetite. The IMF estimates that a 10% dollar appreciation driven by global financial forces reduces emerging-market output by 1.9% after one year, with the drag lingering for two and a half years.
In emerging markets, a US rate shock can do similar damage without a broad surge in the dollar. During the 2013 "taper tantrum", markets reacted to signals that the Federal Reserve would slow its bond purchases. Between early May and early September, the 10-year US Treasury yield rose about 1.4 percentage points. The dollar gained only about 4% against advanced-economy currencies, but about 9% against emerging-market ones.
The damage was uneven. Currencies fell furthest where current-account deficits, inflation, or external debt were high and reserves were thin. They also fell furthest where foreign investors had crowded into carry trades, borrowing in low-rate currencies to buy higher-yielding ones.
Interest rates drive the dollar — until they don't
The intuition that higher US rates lift the dollar is reasonable and often correct. A wider expected return on US assets, relative to the rest of the world, attracts capital and bids up the currency. The problem is that it works only some of the time. In other circumstances, different forces prevail.
As financial professionals know, theory supports the exact opposite thesis. Uncovered interest parity (UIP) states that - in the long run - a higher-yielding currency should be expected to depreciate by the size of the interest gap, leaving expected returns equal.
UIP has been contradicted by data since Fama's foundational 1984 study. High-rate currencies have often appreciated, or at least not fallen as predicted, a result known as the forward premium puzzle. Later work by Bussière, Chinn, and co-authors shows the relationship is unstable and shifted after the global financial crisis (GFC), while Chinn and Meredith find that parity holds better over long horizons than short ones - which was the assumption of the theory in the first place.
All that aside, the key point here is not that rates are irrelevant, but that the rate-to-currency link is weak and time-varying (especially in the short-to-medium run), which is precisely the opposite of a dependable trading rule.
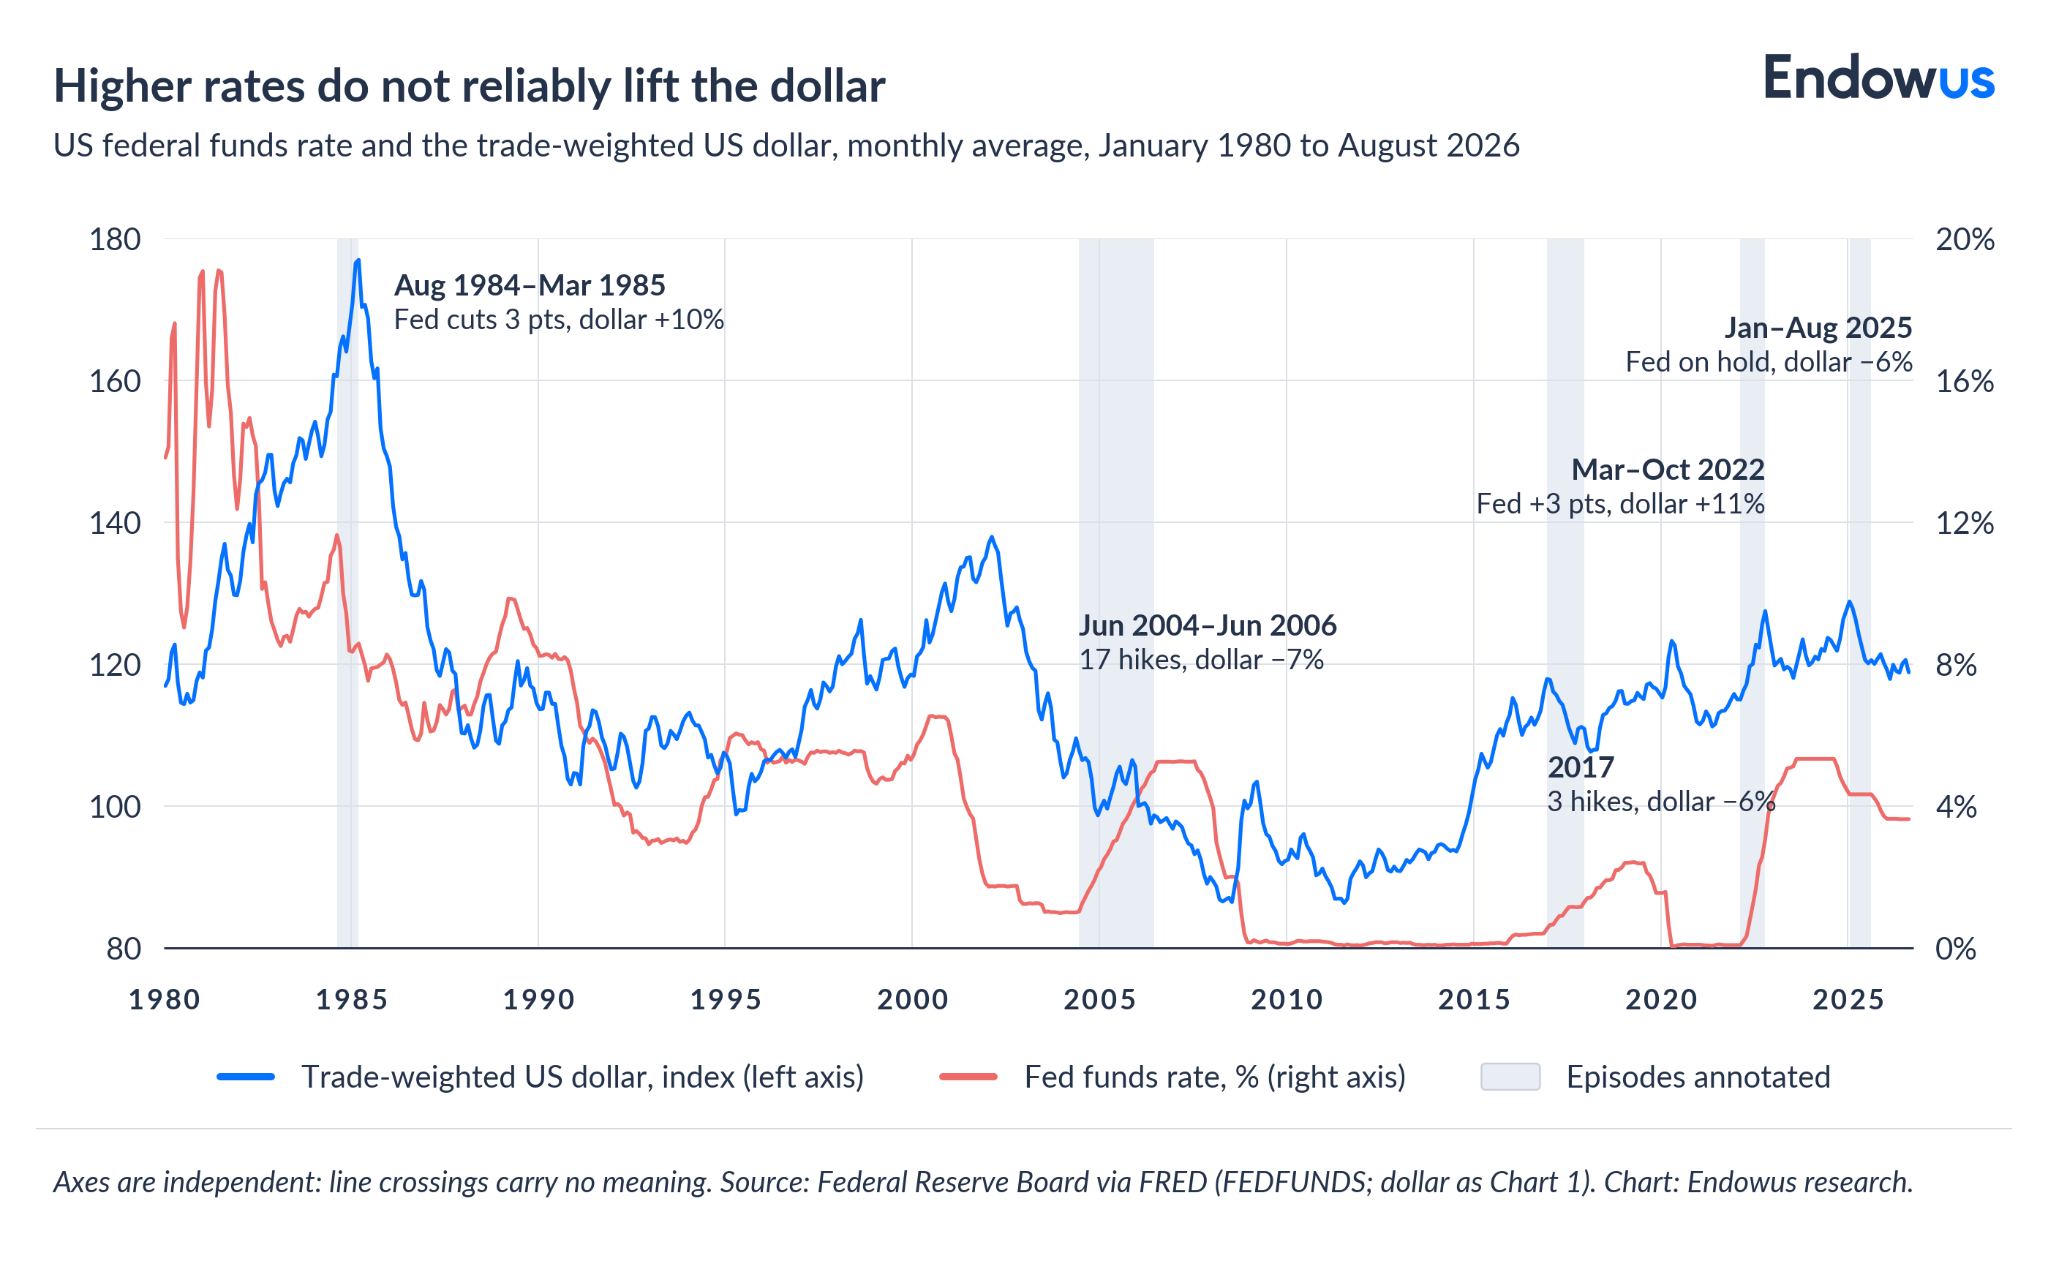
When rates and the dollar move together
The clearest alignments share three features: US tightening that is faster or more unexpected than tightening abroad, a backdrop of US growth outperformance, or an environment of risk aversion. The early 1980s fit the first two; the dollar rose as the Fed drove rates to record highs. In 2014–2016 the Fed moved towards its first hike while the European Central Bank (ECB) and the Bank of Japan (BoJ) eased, and the broad dollar rose about 23%. In 2022 the Fed tightened faster than its peers, and the broad dollar rose about 10% to its October peak. In the final quarter of 2024 the dollar posted its largest quarterly gain since early 2020 on US growth outperformance and a repricing of the Fed's path.
When rates and the dollar diverge
In the final leg of the early-1980s bull run, the dollar rose about 17% between March 1984 and February 1985 even though, as Frankel documents, the US interest-rate differential had peaked in June 1984 and moved the opposite way thereafter. Between June 2004 and June 2006 the Fed raised its target 17 consecutive times, from 1% to 5.25%, yet the dollar fell and the euro rose. In 2017 the Fed hiked three times while the broad dollar dropped 7%, as growth in the euro area and elsewhere caught up and narrowed the forward-looking rate gap. And in the first half of 2025 the broad dollar fell around 6% while the Fed held rates steady — a move the New York Fed linked not only to narrowing differentials but to a weaker relative US growth outlook and heightened policy uncertainty.
Drawing some conclusions from our analysis, we can identify a loose pattern - without venturing into predictions: and that is that the rate “transmission channel” tends to dominate when a widening US rate advantage (higher rates in the US) coincides with relative US strength or with global risk aversion, especially if that rate advantage is unexpected. The same channel tends to be overwhelmed when growth abroad is catching up, when US fiscal or policy uncertainty raises the risk premium on dollar assets, when valuation is already stretched, or when the market looks past the level of rates to the end of the cycle. This is an interpretation of the historical pattern rather but importantly, not a rule.
Where the cycle stands now
The current setting illustrates the multiple channels at work - none of them being truly the sole driver of dollar strength and weakness.
After cutting rates from a peak of 5.25% to 5.50% starting in September 2024 and holding through much of 2025, the Federal Reserve resumed easing late in 2025. The dollar, meanwhile, fell about 7% over 2025 (before rate cuts were resumed in September), then firmed in early 2026 (without any rate hikes) as an energy-price shock following the US–Iran conflict favoured the United States as a net energy exporter. The Fed reversed course later in 2026: on 16 September, it raised the target range by a quarter point to 3.75% to 4.00%, its first increase since 2023.
The driver in 2025 was, presumably, political instability and some vague threats of a US debt default, which would have undermined the credibility of the dollar. Those rumors quickly faded, which stabilized the currency.
As of 18 September 2026, the broad dollar index stood about 7% below its January 2025 monthly peak — well off its 2022 and 2025 highs, but comfortably above its 2008 and 2011 lows (and unchanged since 2025).
The dollar is, in other words, mid-range rather than at an extreme. With the Fed, the ECB, and the BoJ all having moved rates over the past year, the rate-differential story is once again two-sided (thus less important) and geopolitics and energy prices have been the swing factors of 2026.
Going forward, it remains to be seen whether the dollar will appreciate following a potential rate hike cycle, or if other factors - separate from rates - dominate the narrative instead.
Investment implications
Something clear emerges from this analysis of US dollar appreciation and depreciation cycles - that investors need to avoid drawing an automatic connection between rate hikes and dollar strength.
That said, for a globally diversified investor, swings of 35% to 55% in the trade-weighted dollar over multi-year periods can add to, or subtract from, local-currency returns on foreign assets for years at a stretch. That makes it all the more important to gauge the amount of currency exposure in a portfolio, and to what currency(ies) the portfolio is exposed.
One caveat: currency volatility does not necessarily simply add to asset volatility. The two interact just as the volatility of two assets - which, in fact, they are. So it is important to measure correlation between the two to assess the volatility of an investor’s foreign currency-denominated asset exposure.
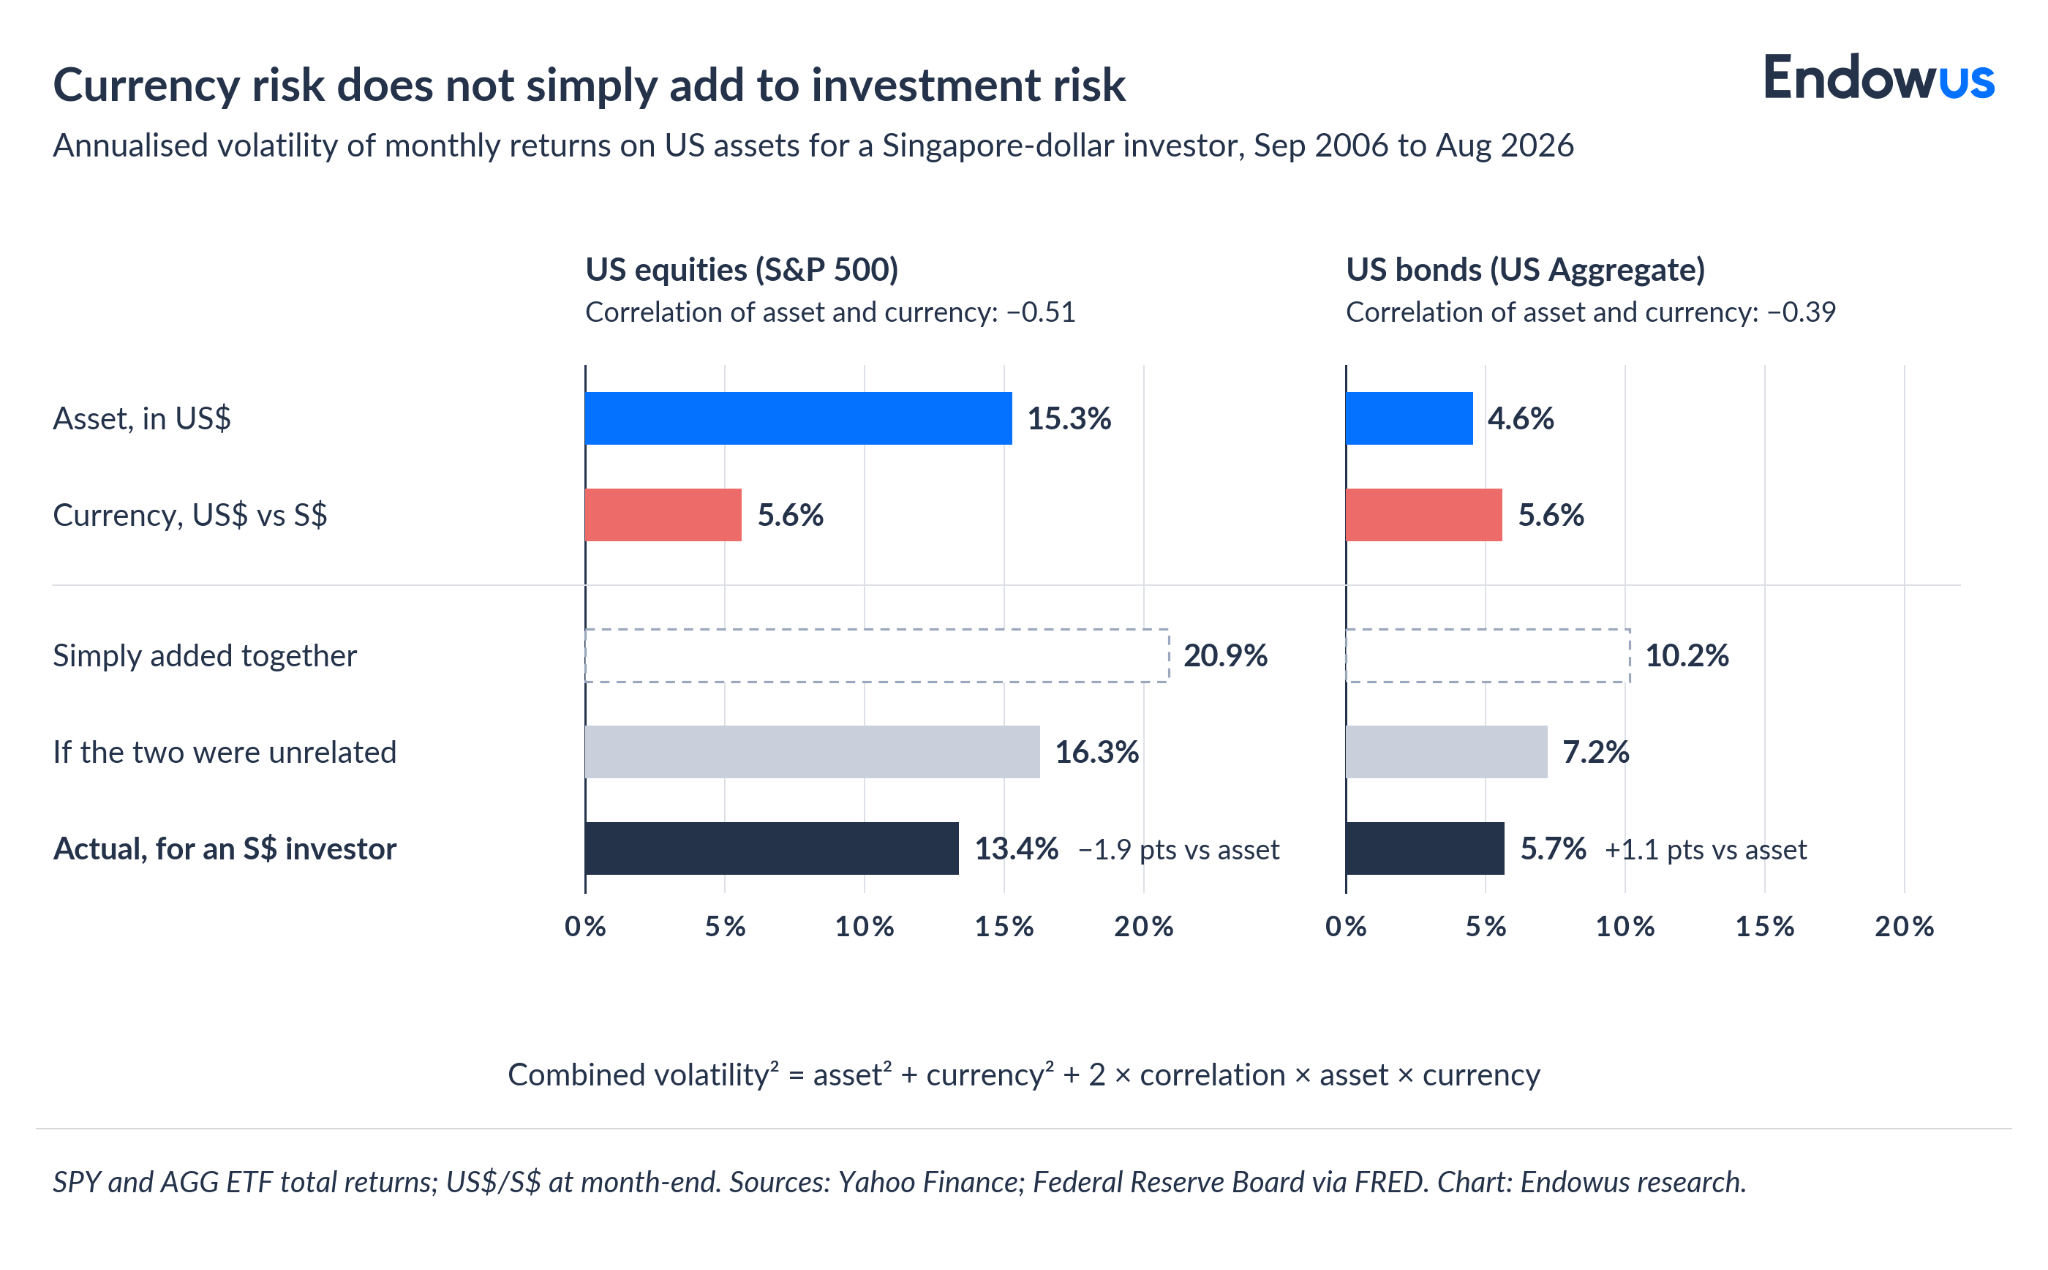
This chart makes it intuitive that there are different incentives to hedge FX exposure for a bond or an equity portfolio. Hedging foreign-currency exposure may reduce volatility particularly for bond allocations since currency swings can exceed the volatility of the bonds themselves.
Currency hedging decisions can also be driven by the investor’s home country’s FX management. If the exchange rate with the US dollar is managed through a peg, the need for a hedge is limited. Factually, a HK dollar and a US dollar exposure will look the same - except for a different yield curve.
If, on the other hand, the local currency of the investor is free floating, then there may be an incentive to hedge US dollar exposure to mute currency fluctuations. As a reminder, Singapore instead manages the Singapore dollar against a basket of currencies along a policy band — the Monetary Authority of Singapore's (MAS) "basket, band, and crawl" framework.
Hedging FX may carry a cost or benefit roughly equal to the short-term interest-rate differential because forward exchange rates are priced off that gap, and unhedged dollar exposure has historically acted as a partial buffer when risk assets fall, with the dollar being used as safe haven. That buffer, however, did not work through the events of 2025, when the dollar weakened alongside rising policy uncertainty.
For emerging economies, the US dollar has an impact beyond FX. As the schematic above shows, a stronger dollar tends to tighten financial conditions through dollar debt, capital flows, and commodity prices.
That link carries through to portfolios. Emerging-market shares and local-currency bonds give investors two exposures at once: the asset and the currency it is priced in. (Local-currency bonds are bonds issued in the borrower's own currency, such as the Indonesian rupiah or Brazilian real.) Both exposures tend to weaken when the dollar strengthens and recover when it softens. Historically, emerging market assets performance has been driven by the dollar. Past performance is not necessarily a guide to future performance or returns.
Making the case for both appreciation and depreciation
The dollar has traded in a band of roughly 96 to 102 since April 2025, without any substantial movement either way.
Skeptics say we are on the verge of a total rethinking of global trade - away from G7 economies towards new markets - and that the dollar that underpinned the system since the end of World War II has recently been “weaponized” in pursuit of political priorities. An example is the freezing of Russia’s dollar-denominated reserves, or the threat of a “tax” to be paid by foreigners wanting to own US Treasuries. There are also more general concerns about the deterioration of the US fiscal balance.
On the other hand, the dollar bullish case rests on its role as a safe haven - in times of heightened geopolitical uncertainty - as well as on the strength of the US economy, especially amidst the AI revolution. Rates are, of course, part of the cyclical argument as well - the Fed just raised short-term rates and investors are pricing in further hikes by the end of this year and in 2027.
Building a portfolio that does not depend on the call
We believe the more durable approach is a portfolio that does not rely on either dollar appreciation or depreciation. In practice, that can mean either of two things:
- spreading currency exposure across several currencies rather than concentrating it in one
- setting a consistent hedging policy and keeping it through the cycle, irrespective of the moves.
A consistent policy takes the dollar call out of the decision. Consider an investor who hedges half of their foreign-currency exposure. They do not capture the full gain if the dollar weakens, and they do not bear the full loss if it strengthens. Hedging is not free, though. Its cost or benefit roughly reflects the gap between interest rates in the two currencies, so it is worth checking before deciding how much to hedge.
In summary
- The dollar moves in long cycles of large amplitude. Recognising the cycle matters more for portfolio construction than predicting its next turn.
- A stronger dollar tightens emerging-market conditions mainly through dollar debt, capital flows, and commodity prices.
- Interest rates (in the US relative to other countries, and specifically to the eurozone) are an important but unreliable driver of dollar moves; growth, risk appetite, valuation, and policy credibility can and do override the rate gap.
- Currency exposure is a deliberate portfolio decision. Diversifying across currencies, or applying a consistent hedging policy, avoids depending on a single view of the dollar.
Webinar: Travel, market and crypto bubbles
.png)
We are heading into bubble trouble

Endowus 2020 review and 2021 outlook



%20F1(2).webp)

.webp)
.webp)






.webp)