

.webp)
.webp)
.webp)
.webp)


.webp)


%20(1).gif)

Register for the event
Endowus invites you to our exclusive event with Macquarie Asset Management, as we discuss unlocking opportunities in Infrastructure- a $1.3tn asset class.
This event is reserved for Accredited Investors (AIs) only. To register for the event, please indicate one of the following:
- Volatility, a structural feature of financial markets, is the annualised standard deviation of asset returns. It is a statistical measure of the dispersion of price changes around their mean over a defined period.
- Short-term volatility spikes are typically driven by a mix of macroeconomic shifts, geopolitical shocks, liquidity dynamics, and investor sentiment.
- Investors who remain diversified, maintain a long time horizon, and rebalance systematically are better positioned to navigate volatile periods than those who attempt to time the market.
The historical record shows that assets which have delivered meaningful real returns over long periods—equities, real estate, credit—have generally done so alongside significant short-term price fluctuations. Whether that relationship reflects compensation for bearing uncertainty, or simply the mechanics of how productive assets are priced, remains debated.
What is clear is that investors who exited during periods of elevated volatility have consistently earned lower long-run returns than those who stayed invested. The assets that minimise short-term fluctuations—cash, short-dated government bills—typically offer more stable but lower expected real returns and, in inflationary environments, may carry genuine purchasing power risk.
This piece examines the mechanics of market volatility: how it is defined and measured, what drives it in practice, and what the empirical evidence suggests smart investors should do when it spikes. We draw on market history, factor research, and portfolio construction principles throughout.
What is volatility, and how is it measured?
In financial markets, volatility refers to the degree to which the price of an asset fluctuates over a given period. A stock or index that on average moves 3% in a day is defined as having a higher volatility than one that moves 0.3%. More precisely, volatility is typically measured as the standard deviation of returns—a statistical measure of how widely individual returns are distributed around an average.
Standard deviation captures both upward and downward movements. An asset that rises sharply one week and falls sharply the next records high volatility, even if the net change over the period is small. This is an important point: volatility is not the same as loss. A volatile portfolio may finish the year well ahead; a low-volatility portfolio may still decline steadily. Risk and volatility are related, but they are not identical.
Two forms of volatility are commonly referenced in practice. Realised volatility (also called historical volatility) is backward-looking—it measures how much an asset has moved over a defined past period, typically expressed as an annualised percentage. Implied volatility, by contrast, is forward-looking. It is derived from the pricing of options contracts and reflects the market's collective expectation of how much an asset may move over a future period.
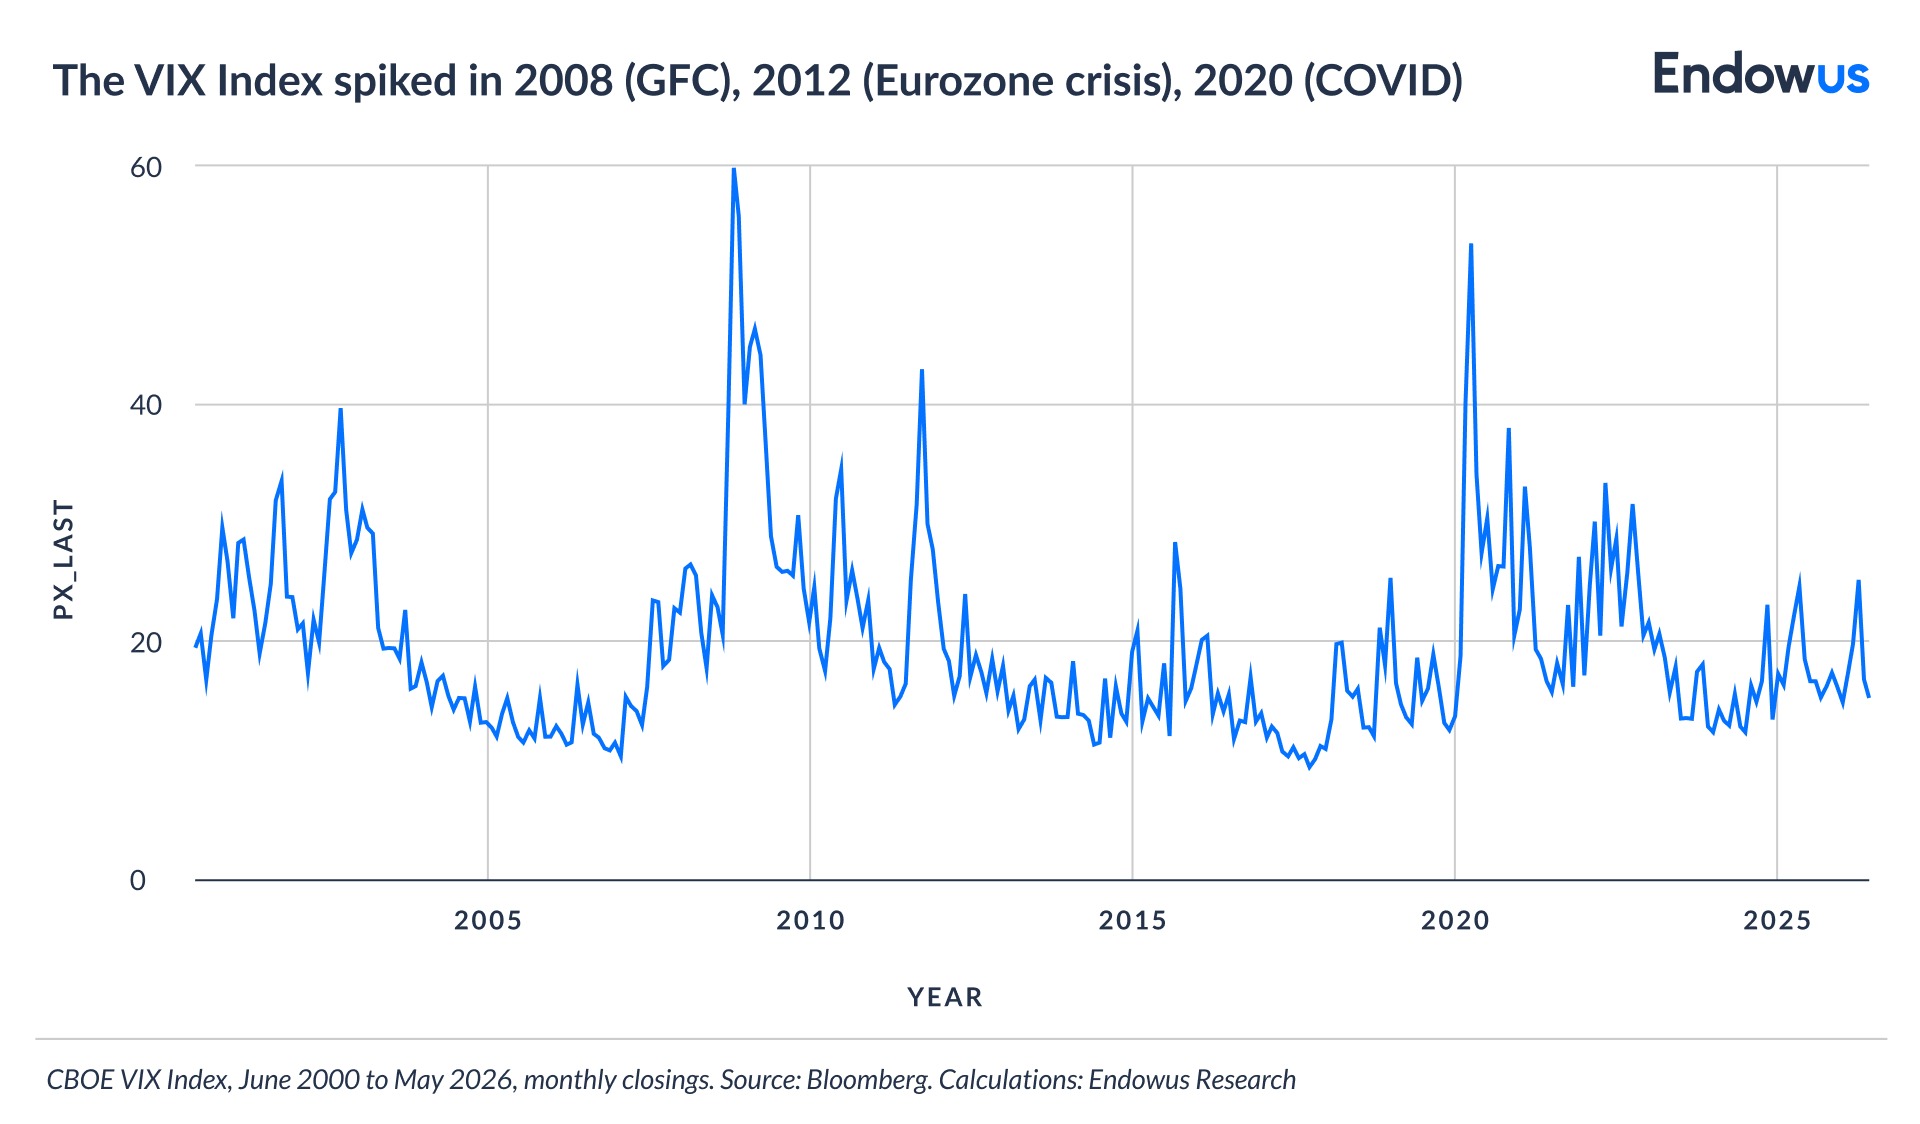
The most widely cited measure of implied volatility in equity markets is the CBOE Volatility Index (VIX), which tracks expected 30-day volatility on the S&P 500 based on options pricing. A VIX reading below 20 is broadly associated with calm market conditions; readings above 30 typically reflect elevated uncertainty. On a month-end close basis—the most consistent basis for historical comparison—the VIX peaked at 59.89 at the end of October 2008 during the GFC, remaining elevated through February 2009 before gradually subsiding. During the COVID-19 shock, the month-end close peaked at 53.54 at the end of March 2020, having risen from 13.78 at the close of 2019.
What causes market volatility?
No single factor drives market volatility. In practice, it arises from the interaction of several forces, each of which can amplify the others under stress.
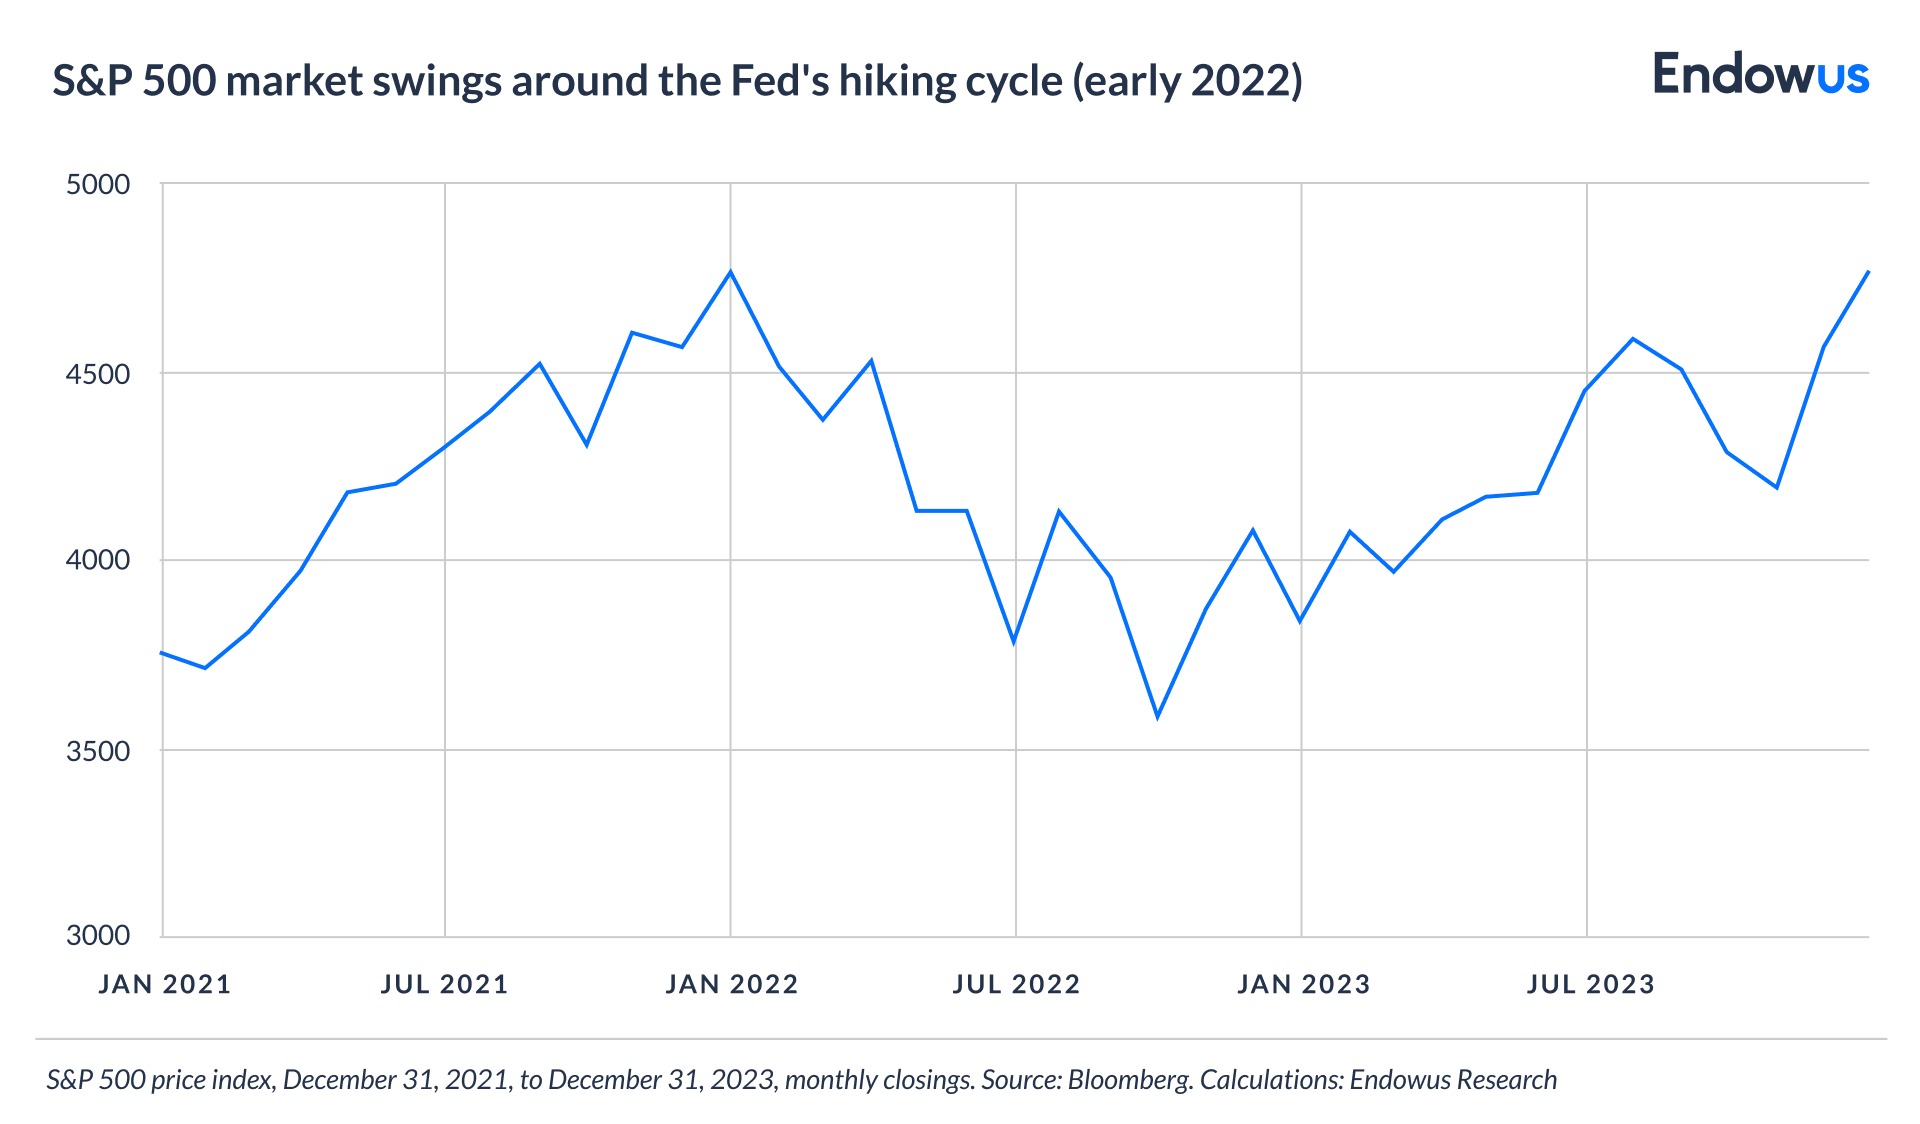
Macroeconomic data and policy surprises are among the most consistent drivers. Markets continuously price in expectations about economic growth, inflation, and interest rates. When actual data—a stronger-than-expected jobs report, a surprise shift in central bank guidance—departs meaningfully from those expectations, prices adjust rapidly. The sharpest volatility episodes of recent years have frequently coincided with central bank policy pivots: the US Federal Reserve's aggressive rate hiking cycle beginning in early 2022, for instance, generated sustained equity and bond market volatility through most of that year.
Geopolitical events inject uncertainty that markets find difficult to price because the range of possible outcomes is wide and the timing is unpredictable. The Russian invasion of Ukraine in February 2022 triggered an immediate energy and commodity price shock. Trade disputes, sanctions regimes, and military escalations each can introduce a category of risk that standard economic models are poorly equipped to quantify.
Liquidity conditions are also key in shaping how volatility manifests. In deep, liquid markets, new information is absorbed relatively smoothly as buyers and sellers continuously negotiate prices. In thin or stressed markets—during holidays, at market open, or when major institutions are simultaneously de-risking—price movements are amplified because there are fewer counterparties willing to absorb the imbalance. Forced selling by leveraged investors, margin calls, and fund redemptions can all reduce liquidity rapidly and accelerate a drawdown.
Investor sentiment and behavioural dynamics compound the underlying fundamental drivers. Fear of missing out (FOMO) drives speculative frenzies; fear of loss drives indiscriminate selling. Both are well-documented in financial literature and both generate price movements that are disproportionate to changes in underlying fundamental value. High-profile initial public offerings (IPOs), retail trading surges, and the rapid rotation between sectors and themes all reflect sentiment-driven volatility as much as fundamentals.
Structural factors in modern markets contribute as well. The growth of passive index-tracking strategies means that flows in and out of index funds can move constituent stocks simultaneously, regardless of individual company fundamentals. Algorithmic trading and momentum strategies may accelerate short-term price dislocations. Options markets, when large amounts of open interest concentrate around particular strike prices, can force dealers to hedge in ways that mechanically amplify spot market moves—a dynamic that received significant attention during certain US equity market episodes in 2020 and 2021.
Is volatility the same as risk?
The terms are often used interchangeably in financial journalism, but the distinction matters for investors.
In academic finance, volatility—specifically standard deviation of returns—has historically served as a proxy for investment risk. Modern portfolio theory, developed by Harry Markowitz in the 1950s, formalised the relationship between expected return and variance (the square of standard deviation), yielding the concept of the efficient frontier: the set of portfolios that maximise expected return for a given level of volatility.
The practical critique of this framework is that short-term price fluctuations are not the same as permanent capital loss, which is what most investors actually fear. A well-diversified equity portfolio that falls 30% in a single year and fully recovers within two years has generated significant volatility—but no permanent damage for an investor who stayed invested. Conversely, an asset that produces slow, steady losses year after year may display low measured volatility but cause real financial harm.
A more useful framing for long-term investors may be to distinguish between temporary mark-to-market drawdowns and permanent impairment of capital. The former is a feature of owning productive assets through cycles; the latter is what requires genuine mitigation. Concentration risk—overexposure to a single company, sector, or geography—creates permanent loss risk. Poor market timing—selling into drawdowns and buying at peaks—converts temporary volatility into permanent loss.
Why does volatility rise in falling markets and fade in rising ones?
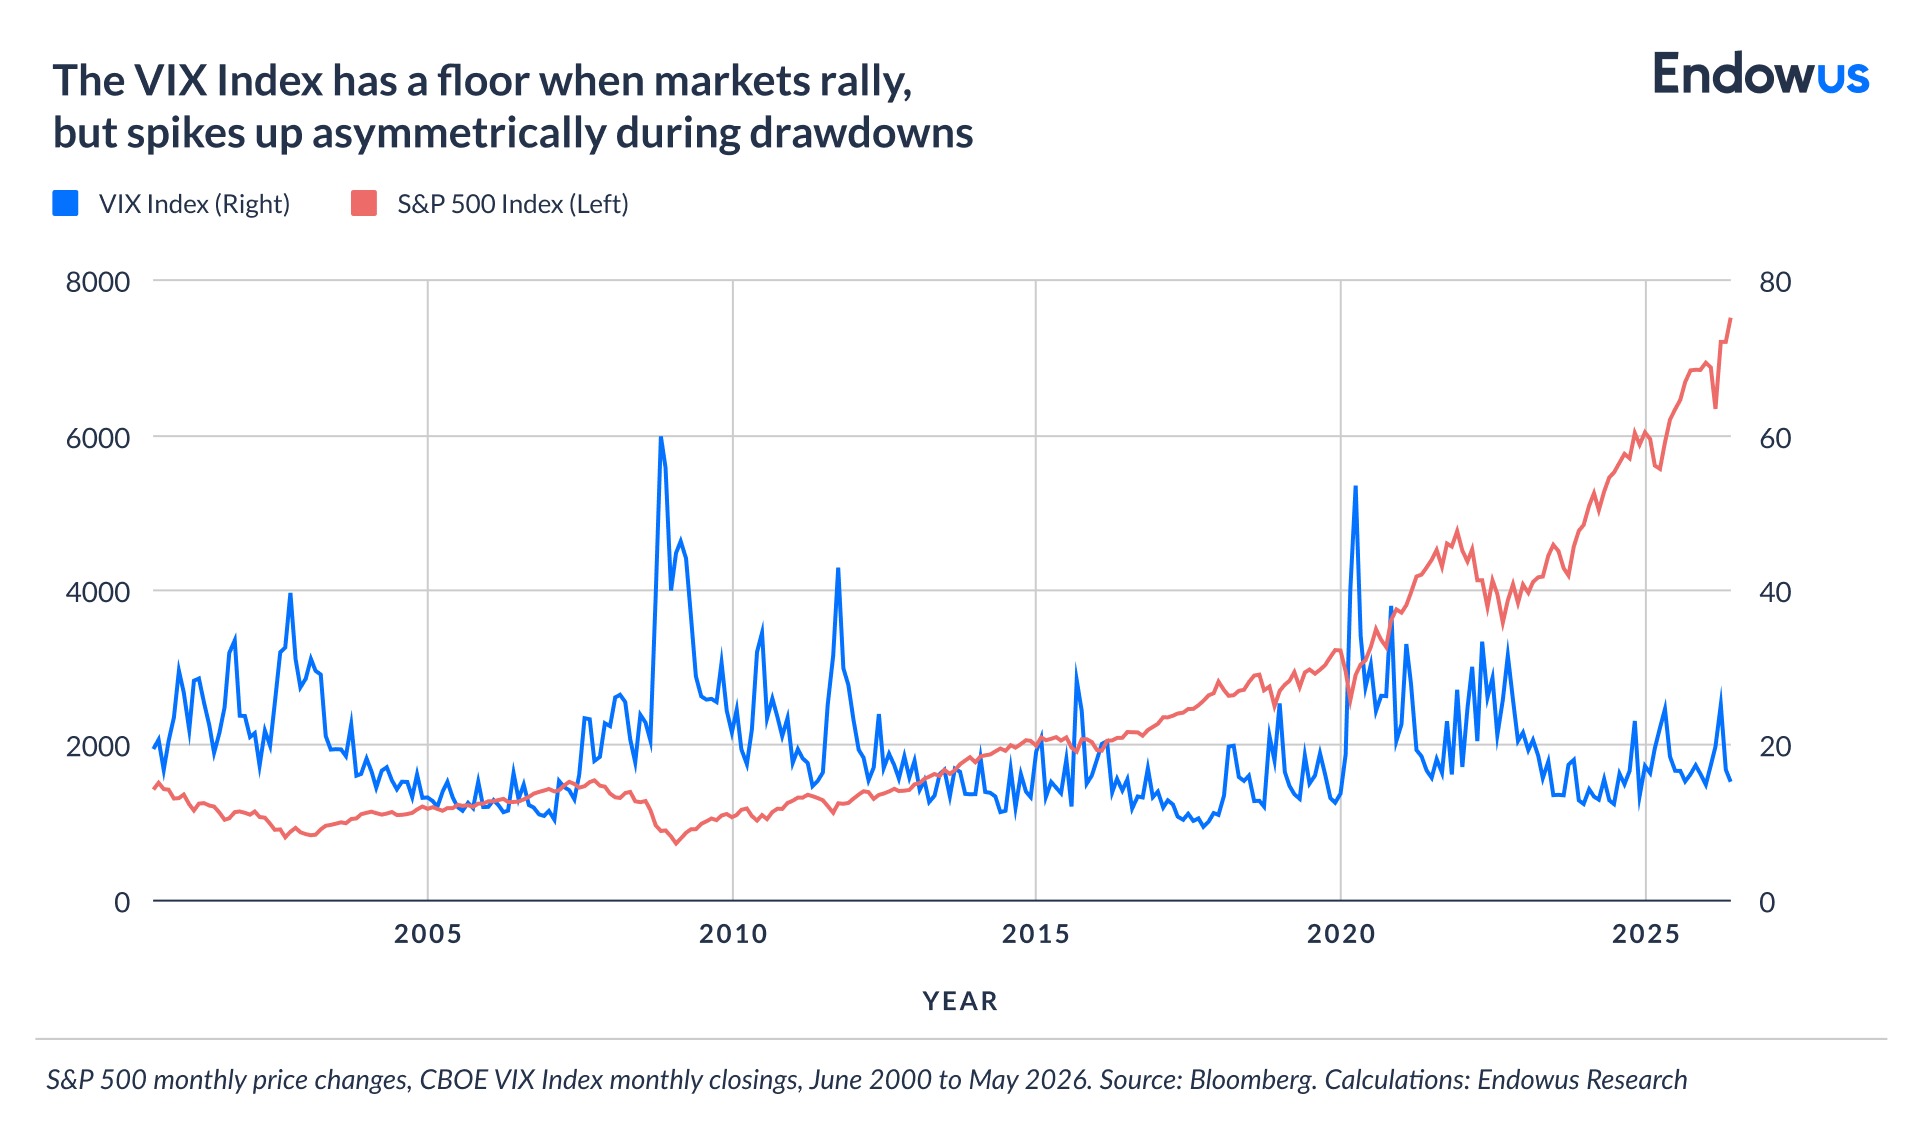
One of the most consistent and perhaps hard to grasp features of financial markets is that volatility behaves asymmetrically: it tends to spike sharply during selloffs and compress gradually during rallies. This is not random. It reflects several structural mechanisms that reinforce each other under stress.
The most studied explanation is the leverage effect, first formalised by Fischer Black in 1976. When equity prices fall, a company's debt-to-equity ratio rises mechanically—the same nominal debt now sits against a smaller equity base. Higher financial leverage makes future earnings more uncertain and more sensitive to further shocks. Equity return volatility therefore increases as prices decline, and decreases as prices rise and leverage falls. This relationship holds at the individual company level and aggregates to the index level.
A second mechanism is the risk model feedback loop. As prices fall, measured historical volatility rises. Risk management systems at institutional investors—banks, funds, and insurers—flag elevated risk, which triggers de-risking mandates, which causes further price falls, which raises volatility further. It is a procyclical loop, and it is one reason why volatility crises tend to be self-amplifying. The reverse operates in calm markets: low volatility reduces modelled risk, encourages position-building, and compresses risk premia.
Options market dynamics compound both effects. During selloffs, demand for downside protection—put options—rises sharply as investors seek to hedge existing positions. Because implied volatility is derived directly from options pricing, the surge in put-buying drives the VIX higher. During rallies, there is no symmetric surge in demand for upside calls; implied volatility drifts lower rather than spiking. This is why the VIX is frequently described as a fear gauge rather than a symmetric uncertainty measure. Fear is directional in ways that confidence is not.
Liquidity withdrawal reinforces the pattern. In declining markets, market makers and liquidity providers pull back, widening bid-ask spreads. With fewer counterparties willing to absorb order flow, individual trades move prices more—mechanically amplifying volatility. In rising markets, liquidity tends to be abundant and price impact per trade is lower. The effect is particularly pronounced in thinner markets and during simultaneous de-risking by multiple large institutions.
The practical implication is important. Strategies that systematically sell options to capture the volatility risk premium—known as short-volatility strategies—earn returns precisely because implied volatility tends to exceed realised volatility over time. But the asymmetry means that losses, when they arrive, are rapid and large. The compression of volatility during calm periods also flatters risk measures that rely on recent return history, which is why portfolio models built in low-volatility environments frequently underestimate risk when conditions shift.
What does history tell us about volatility and long-term returns?
The empirical record on equity market recoveries is broadly consistent across geographies and time periods, though past performance is not necessarily a guide to future performance or returns.
According to a Yardeni Research study from the end of 2024, US equity markets, as measured by the S&P 500, have experienced 22 bear markets—declines of 20% or more on a closing basis—since 1928, with an average peak-to-trough decline of approximately 37%. In every instance, markets recovered to new highs—though the time required varied enormously, from a matter of months to, in the most extreme cases, over a decade. The broad lesson is not that recoveries are guaranteed, but that the historical probability of recovery—at a diversified index level—has been high for investors with sufficiently long time horizons.
Dimensional Fund Advisors' research into global equity markets shows that equity premiums—the excess return of equities over risk-free assets—have been positive over long horizons across most major markets, but that the realisation of those premiums requires tolerating significant short-term volatility.
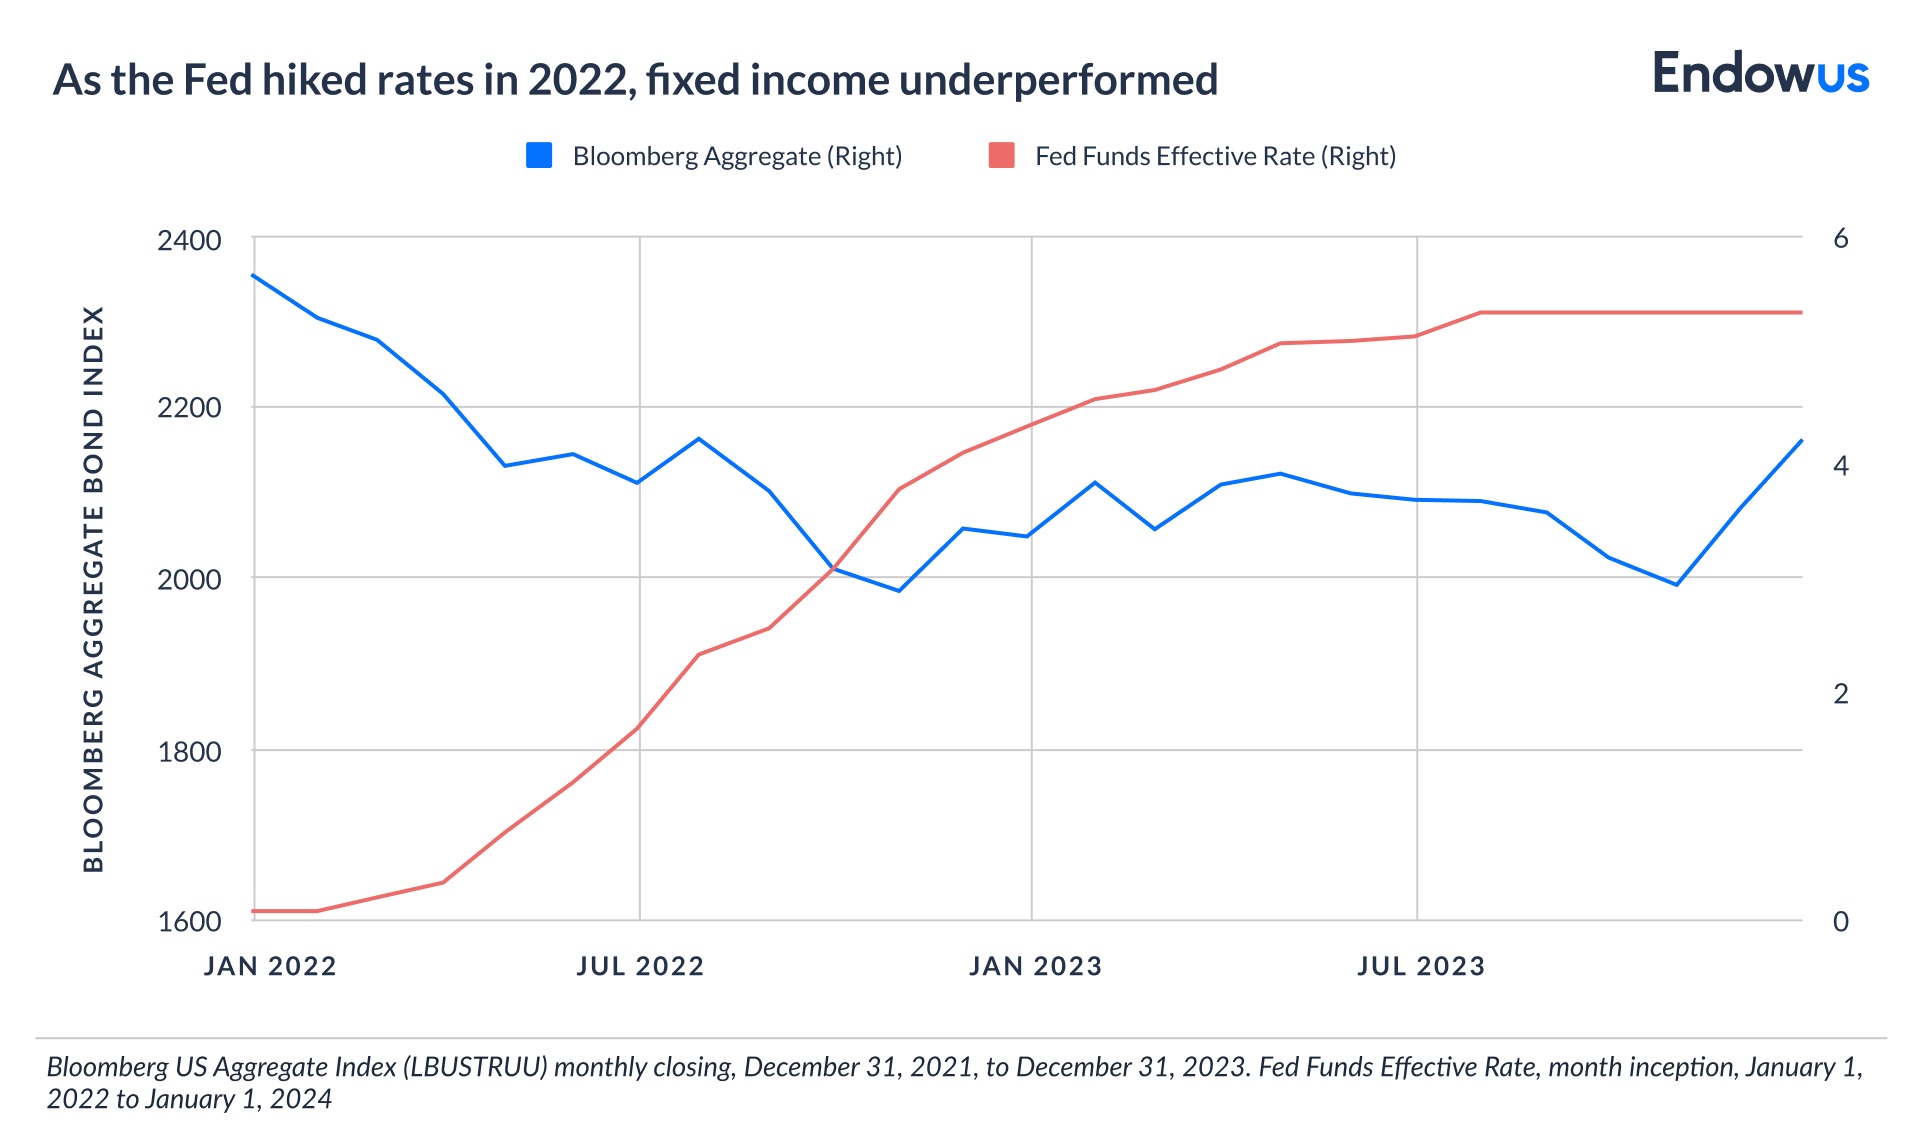
Bond markets behave differently. Duration risk—the sensitivity of bond prices to interest rate changes—means that rising-rate environments produce short-term losses even on high-quality government bonds. The 2022 US Treasury market downturn, driven by the fastest interest rate increase cycle in four decades, produced negative returns across almost all fixed income categories. This was unusual but not unprecedented. For balanced portfolio investors, the key insight is that bond and equity volatility do not always offset each other.
How should investors navigate periods of high volatility?
The academic literature and the evidence from investor behaviour are unusually consistent on this point: most attempts to actively time the market around volatility episodes destroy value relative to staying invested.
Research has consistently documented the 'behaviour gap'—the difference between the returns that funds produce and the returns that investors in those funds actually earn. The gap exists because investors systematically buy after periods of strong performance and sell after periods of weakness, achieving returns below what a passive buy-and-hold approach would have delivered. Market timing is a negative-sum game after transaction costs and taxes.
The practical alternative is systematic rather than reactive portfolio management. Rebalancing—returning a portfolio to its target asset allocation after significant market moves—is one of the few portfolio management activities that has empirically improved risk-adjusted returns. By buying relatively underperforming assets and trimming relatively outperforming ones, systematic rebalancing enforces a degree of contrarian discipline.
Diversification reduces volatility at the portfolio level even when individual asset volatility is high (see calculator and mathematical formula above). The correlation between different asset classes—equities and bonds, developed and emerging markets, public and private assets—is typically less than one, meaning that combining them reduces overall portfolio volatility without necessarily reducing expected returns. The caveat is that correlations tend to rise during acute market stress events, reducing the diversification benefit precisely when it is most needed.
Maintaining an appropriate time horizon is perhaps the single most important factor. For an investor with a 20-year horizon, the short-term fluctuations of a volatile quarter are largely irrelevant to outcomes. For an investor with a two-year horizon, they are not. Portfolio construction should match the investor's genuine time horizon—and a key function of financial planning is to avoid situations where long-term capital is exposed to short-term liquidity needs.
Volatility in different asset classes
Equities are the most visible source of portfolio volatility for most investors, but not the only one. Understanding how volatility manifests across asset classes helps in constructing portfolios that are resilient across different market environments.
Within equities, volatility varies significantly across geographies, market capitalisations, and sectors. Smaller companies tend to exhibit higher volatility than large-cap peers, partly because their earnings are more concentrated and their shares less liquid. Emerging market equities carry additional currency and political risk. Technology and growth sectors—whose valuations depend heavily on long-duration earnings forecasts—tend to be more sensitive to interest rate movements and more volatile in rate-rising environments.
Bonds exhibit volatility primarily through duration and credit risk. Long-dated government bonds are more sensitive to interest rate changes than short-dated equivalents. High-yield corporate bonds carry credit risk—the risk of default—that causes them to behave more like equities during risk-off episodes.
Private markets—private equity, private credit, real assets—present a different challenge. Their valuations are updated infrequently and based on appraisal methodologies rather than real-time market prices, which means their measured volatility is artificially low. This 'smoothing' effect should not be confused with genuine risk reduction. Investors in private markets accept a different kind of uncertainty, including illiquidity risk and the inability to exit positions quickly during periods of market stress.
Currencies, when relevant, add another dimension of volatility for investors holding international assets.
Investment implications: Building a portfolio for the long term
In our view, the central investment implication of understanding volatility is not to avoid it—that is neither possible nor, for long-term investors, desirable.
The practical goal is to structure a portfolio that can withstand the volatility you are likely to encounter without forcing you into reactive decisions at the worst possible moment. That means holding a genuine mix of asset classes rather than concentrating in any single market or theme. It means setting a target allocation and rebalancing systematically rather than allowing weightings to drift according to recent performance. It means holding a liquidity buffer sufficient to cover near-term spending needs so that equity positions never need to be liquidated under duress.
Endowus provides the diversified, low-cost, evidence-based portfolios, with periodic rebalancing, that make this approach accessible so that investors are potentially more likely to stay invested through volatility rather than being forced out of it at the worst possible time.
Frequently asked questions about volatility
What is the definition of volatility in investing?
Volatility measures how much the price of an asset fluctuates over time. It is typically expressed as the annualised standard deviation of returns—a statistical measure of the dispersion of price movements around their average. High volatility means prices are moving significantly in both directions; low volatility means relatively stable prices. Volatility is a feature of productive assets, not a sign of systemic failure.
What causes stock market volatility to spike?
Sudden spikes in market volatility typically reflect a rapid repricing of risk—either because new information has significantly altered expectations about future earnings or economic conditions, or because a shift in liquidity has amplified price movements beyond what the fundamental information alone would warrant. Common catalysts include central bank policy surprises, geopolitical shocks, unexpected macroeconomic data, and sharp movements in leveraged positions that trigger forced selling. In most historical episodes, the initial spike has exceeded what the underlying economic impact ultimately justified.
Is high market volatility a sign that I should sell?
The empirical evidence consistently shows that investors who exit markets during periods of high volatility lock in losses and frequently miss the subsequent recovery. Missing even a small number of the best days in a given period significantly reduces long-term returns. A more constructive response to elevated volatility is to review whether your asset allocation still reflects your actual risk tolerance and time horizon—and to rebalance if it does not.
How is implied volatility different from historical volatility?
Historical (or realised) volatility measures how much an asset has actually moved over a defined past period. Implied volatility, derived from options pricing, reflects the market's current expectation of how much an asset may move over a defined future period. The VIX index is the most widely tracked measure of implied volatility for US equities. Implied volatility tends to spike during market stress events and compress during prolonged periods of calm—which is why it is sometimes described as a measure of market fear rather than market risk.
Can diversification reduce portfolio volatility?
Because different asset classes, sectors, and geographies do not move in perfect lockstep, combining them in a single portfolio reduces overall volatility according to Harry Markowitz’s modern portfolio theory. The caveat is that correlations between assets tend to rise during acute market stress events, which is precisely when investors want the diversification benefit most. Diversification reduces but does not eliminate portfolio volatility.
Forget your password? It's a good thing for your investments

The lesson of Hyflux: What water and diversification have in common

Free lunch: Diversification in investing is a gift
.jpeg)


%20F1(2).webp)

.webp)


.webp)